If you had to bet, in which minute of a soccer game is a goal most likely to be scored?
With the 2019 FIFA Women's World Cup Final upon us, you may be asking this question yourself. If you're in a betting pool with friends, one of the bets may be on the minute of the first or last goal. Or if you're just watching for fun, you may find yourself on the edge of your seat until either a cliffhanger goal is scored or the game goes into overtime/penalty kicks.
In theory, the distribution of soccer goals should be uniform. That is, if scoring goals is completely random, there is an equally likely chance of scoring a goal in the 11th minute as there is in the 73rd minute. It's no different than a flip of a coin or the roll of a die, but instead of the probability distribution being 1/2 for coins or 1/6 for a die, it is 1/90 for goals.
Obviously, however, scoring in soccer is not completely random and therefore not uniform.
Hypothesis
When I started to think about this question, I thought back to my own experience playing and watching soccer.
During games, especially those that were tied, it was common for intensity to increase near the end. Each team always felt like it was close to winning, and a win was worth 3 points in the standings while a tie was only worth 1 point. This made a significant difference. In an eight-game season, a team with a 3-5-0 losing record would come out on top of a team that tied every game and finished 0-0-8 (9 points vs. 8 points).
On top of that intensity, players were tired by the end of the game and more likely to make mistakes. Therefore, the team with stronger fitness often had a better chance of scoring on its tired opponent.
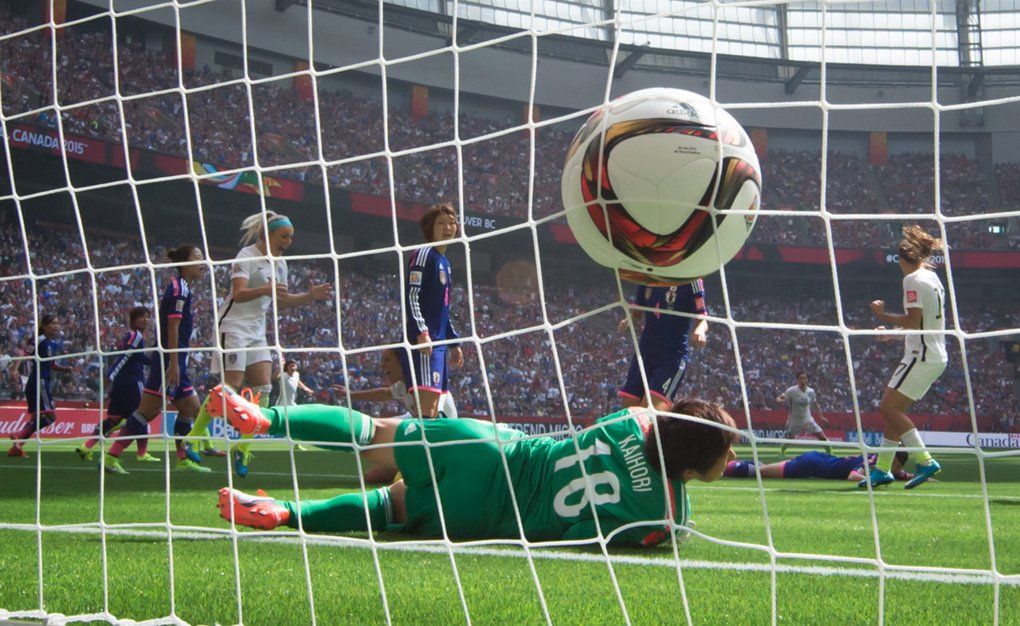
Even if you have never played soccer, you may feel this same principle while watching the World Cup. If the game is close, you'll watch the last 20 minutes more intensely than the first 70 minutes. And your facial expression will probably look something like this:
Therefore, my hypothesis was that more goals are scored in the last few minutes of a game than others. In particular, I thought the 90th minute would have the most goals scored.
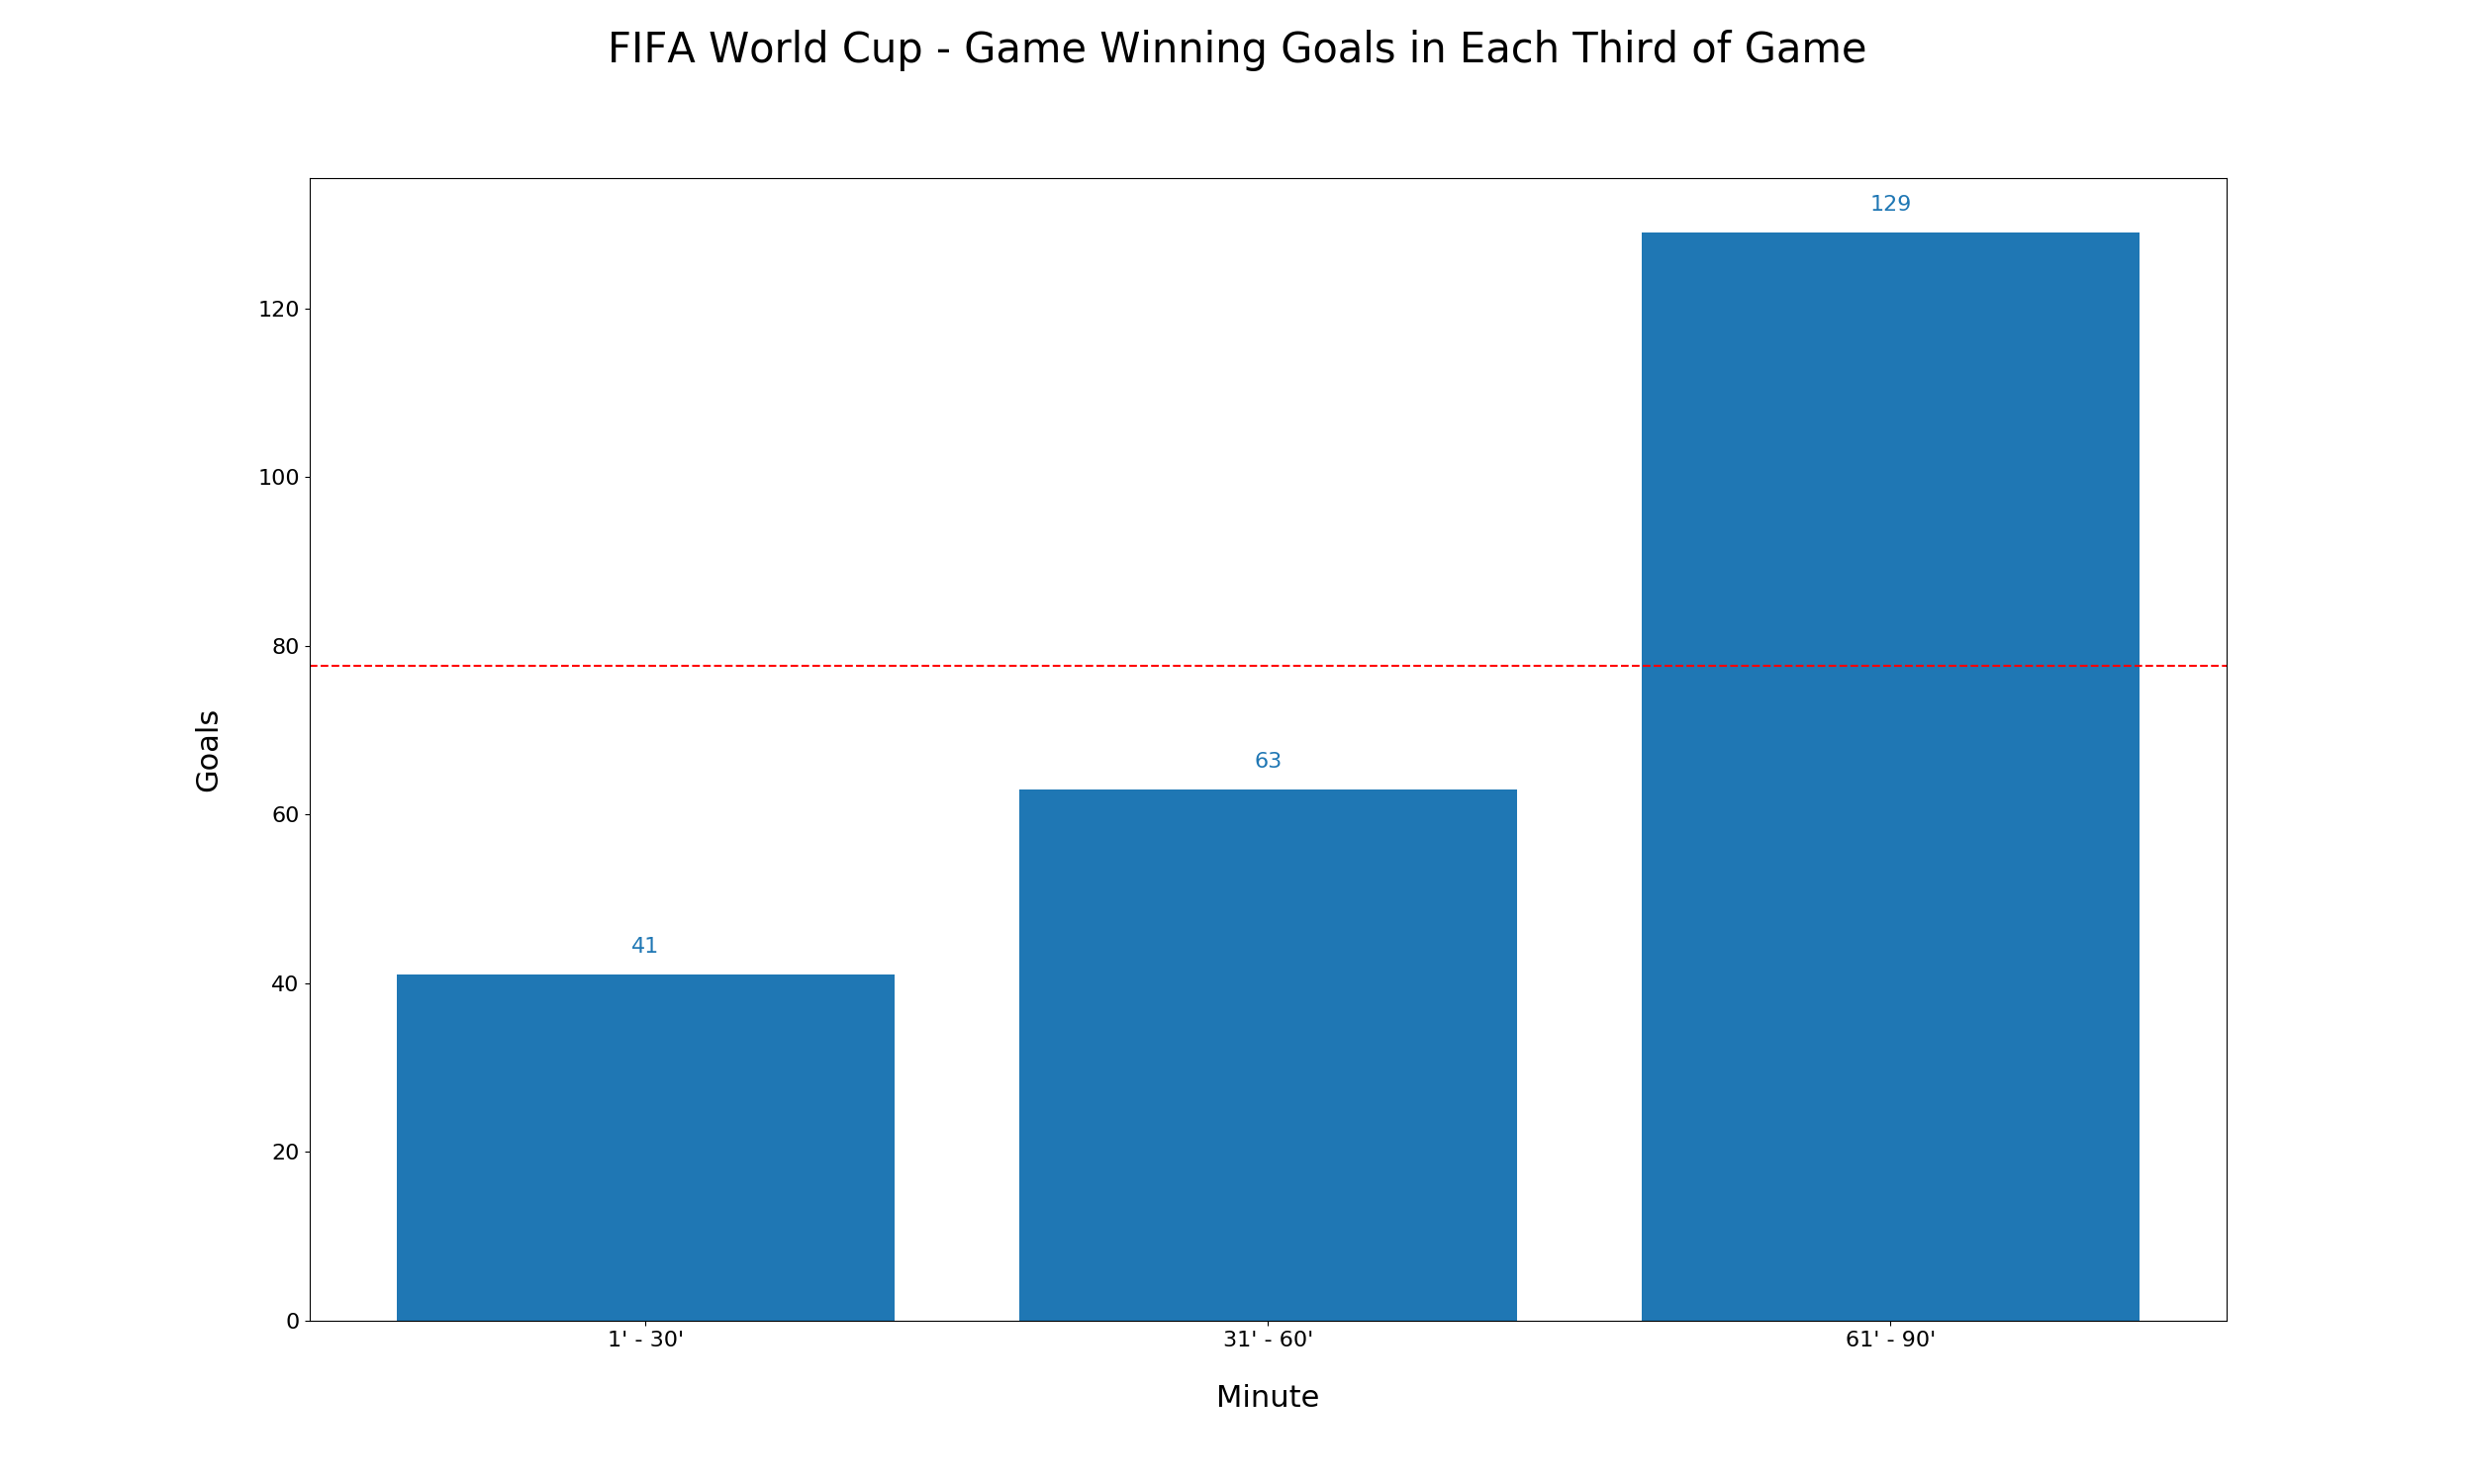
Further, I hypothesized that more game-deciding goals are scored in the last third of the game than in either of the first two thirds.
I suspect this is not only true of soccer, but also other sports that involve scoring over the course of a match. Hockey games feel more intense towards the end of the game when players are already tired and yet trying to overcome defeat, break a tie, or maintain a lead.
It is also probable that end-of-game point scoring is especially likely when scoring occurs infrequently throughout. There may be an existing term for this, but not finding any, I call this point sensitivity. A sport in which few points are scored over the course of the match (soccer) has high point sensitivity, while a sport in which many points are scored (basketball) has low point sensitivity. Because, for example, basketball points happen frequently, teams are less sensitive to any individual point. Meanwhile, an individual goal in soccer may be the only goal for the entire match.
Formally, you could define the point sensitivity of a sport as 1/n, where n is the total number of points scored in a match, on average.*
* Note: 1/√n may be more appropriate to avoid the non-linearity of scoring across sports. For example, cricket and basketball scores tend to be quite large, while soccer scores are often small. Regardless, point sensitivity is likely best modeled with an inverse function.
Methodology
Data Sources
To answer this question, I turned to the FIFA World Cup archives and wrote a small program to scrape the results from 1930, when the World Cup started, to 2014. There are other sources for soccer stats, such as SoccerStats.us or RSSSF, but these sources do not separate out goals scored in extra time. That is, a goal scored in the first minute of extra time in the first half is still marked as a 45' instead of 45+1'; these sources overestimate the goals in the 45th and 90th. The FIFA World Cup archives, however, do not.
As a bonus, I wanted to see if similar goal distributions occur in other soccer leagues instead of just the largest international soccer stage, the World Cup. For this, I performed the same analysis on Premier League soccer games. Again, writing a program to scrape the official source to avoid the extra time issue.
For both of these scrapes, I saved the data to a .json file, which is available along with the code below.
Analysis
Analyzing the data was relatively simple: count up the goals scored in each minute of each game and bucket them by half, quarter, every nine minutes, or any other way. Plus, with the raw data, I could analyze a few other interesting questions, such as:
- Has scoring become more common in the World Cup over time?
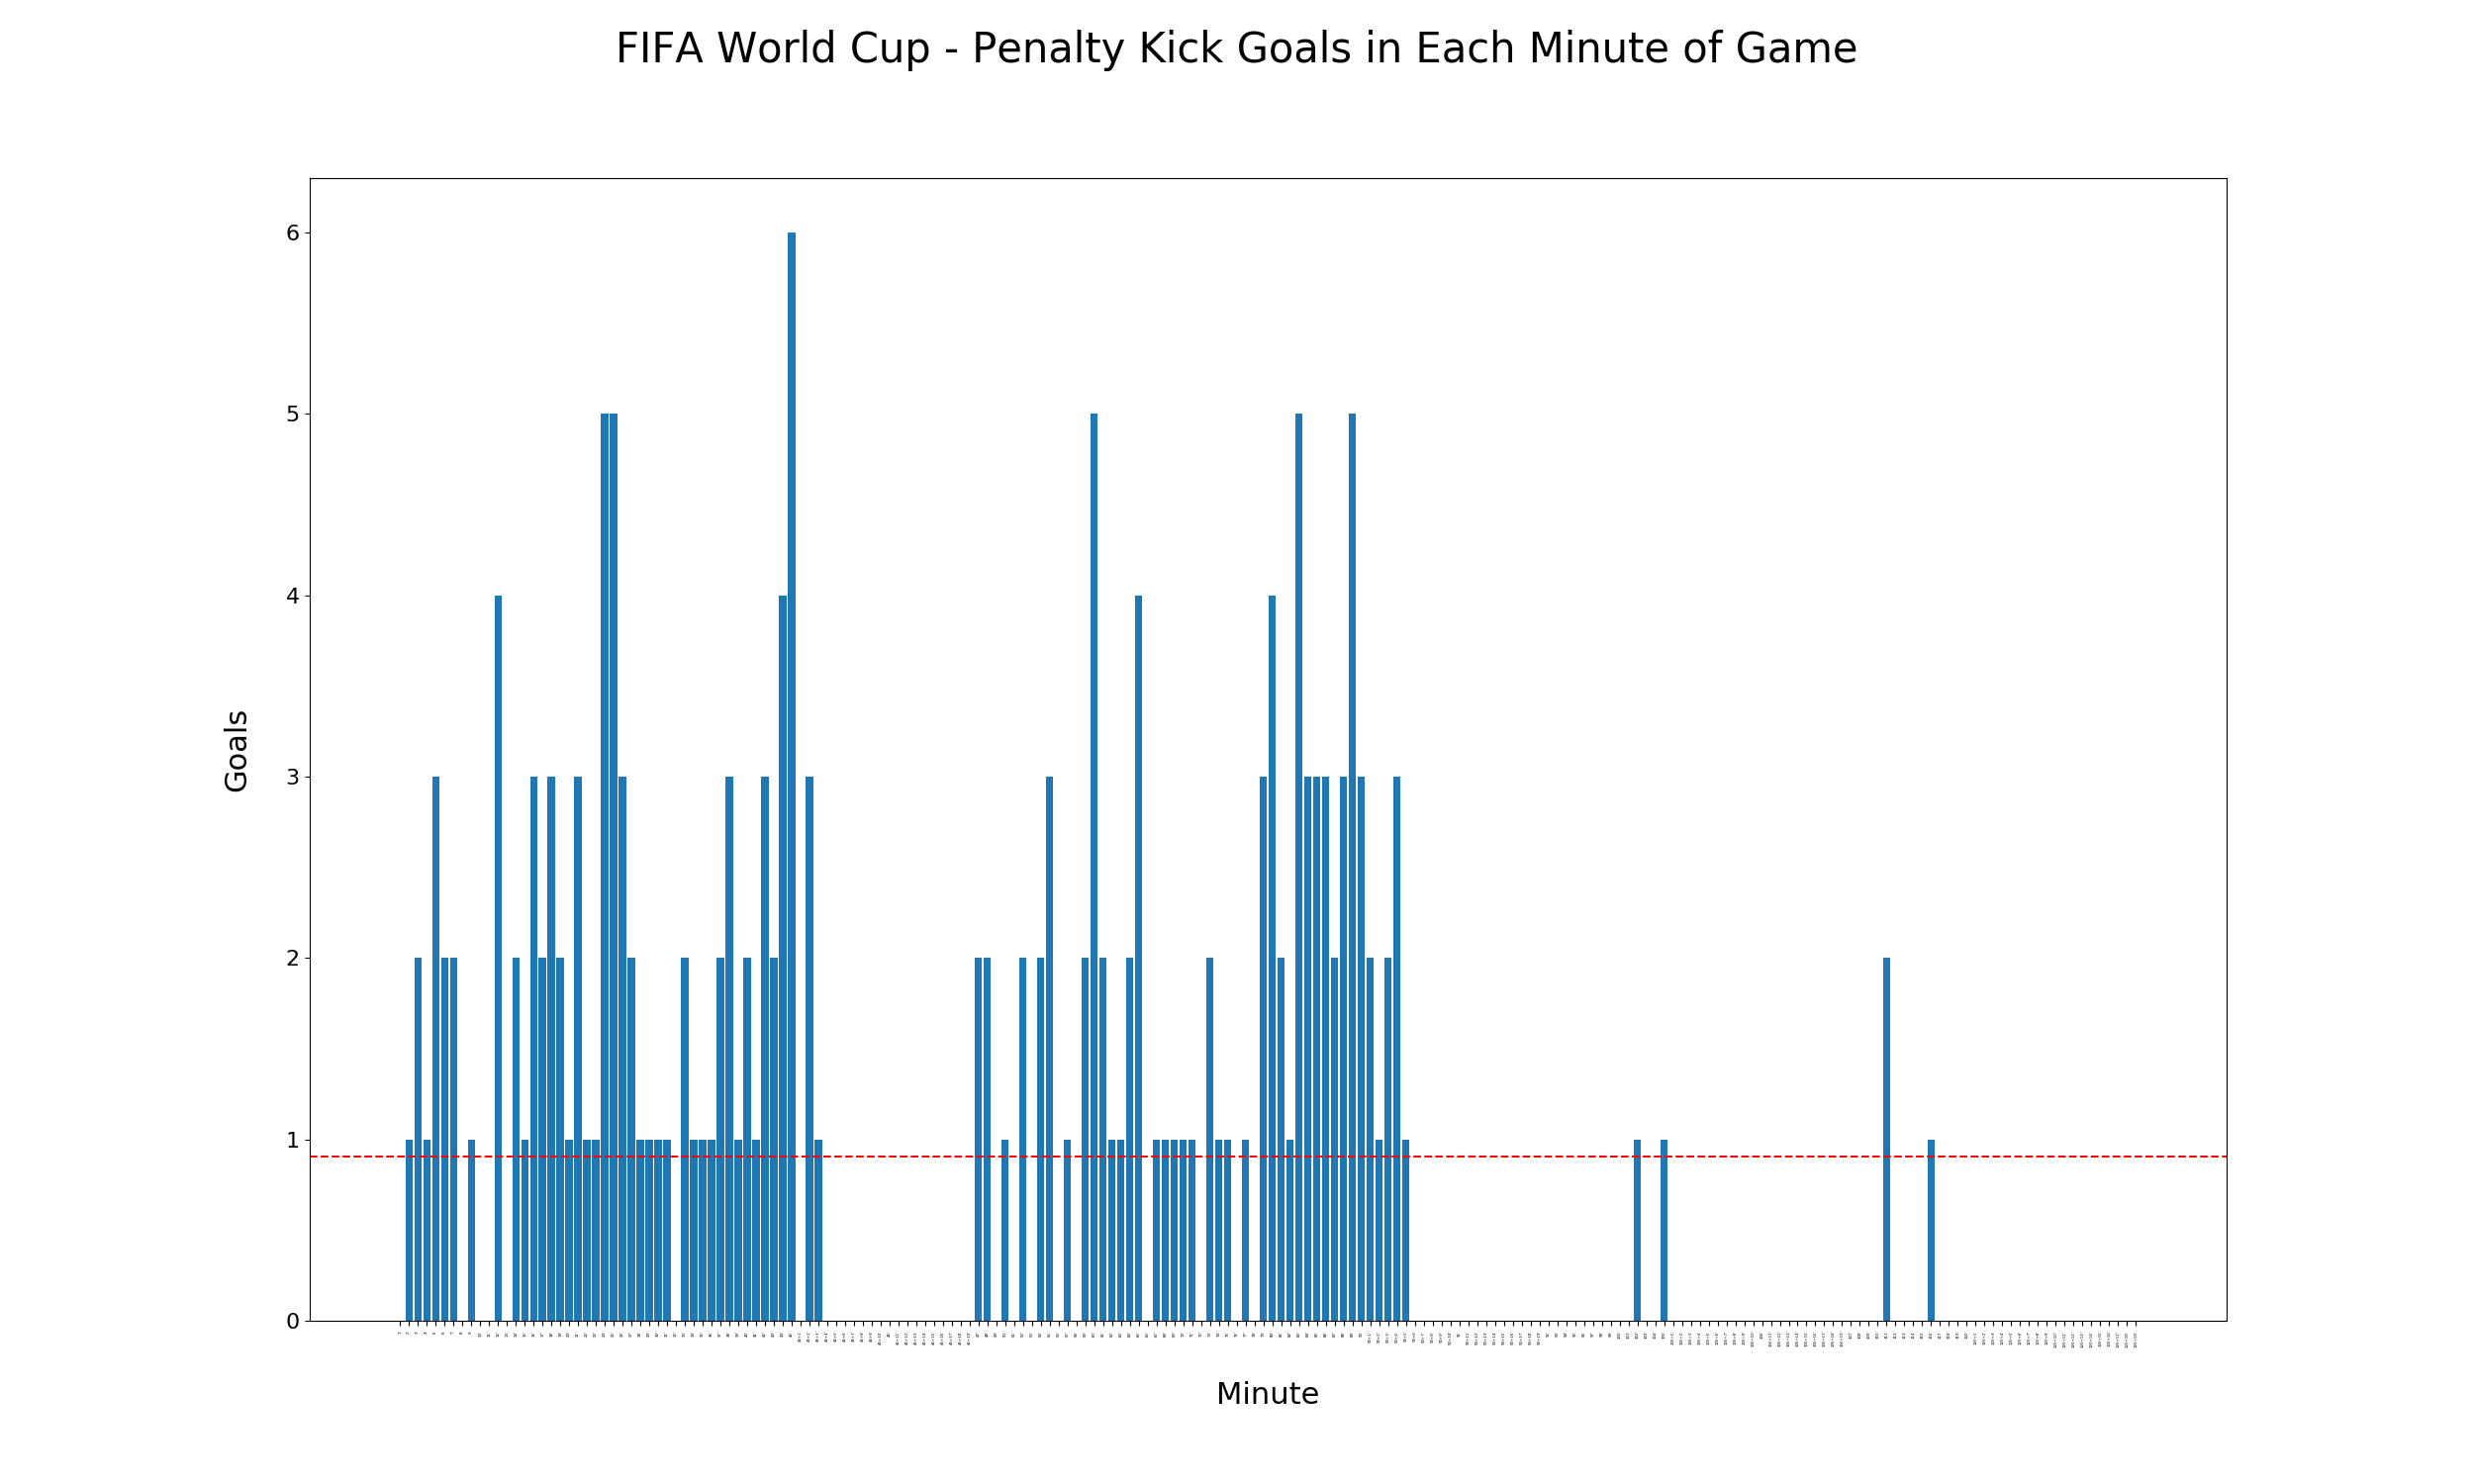
- When are the most penalty kicks scored?
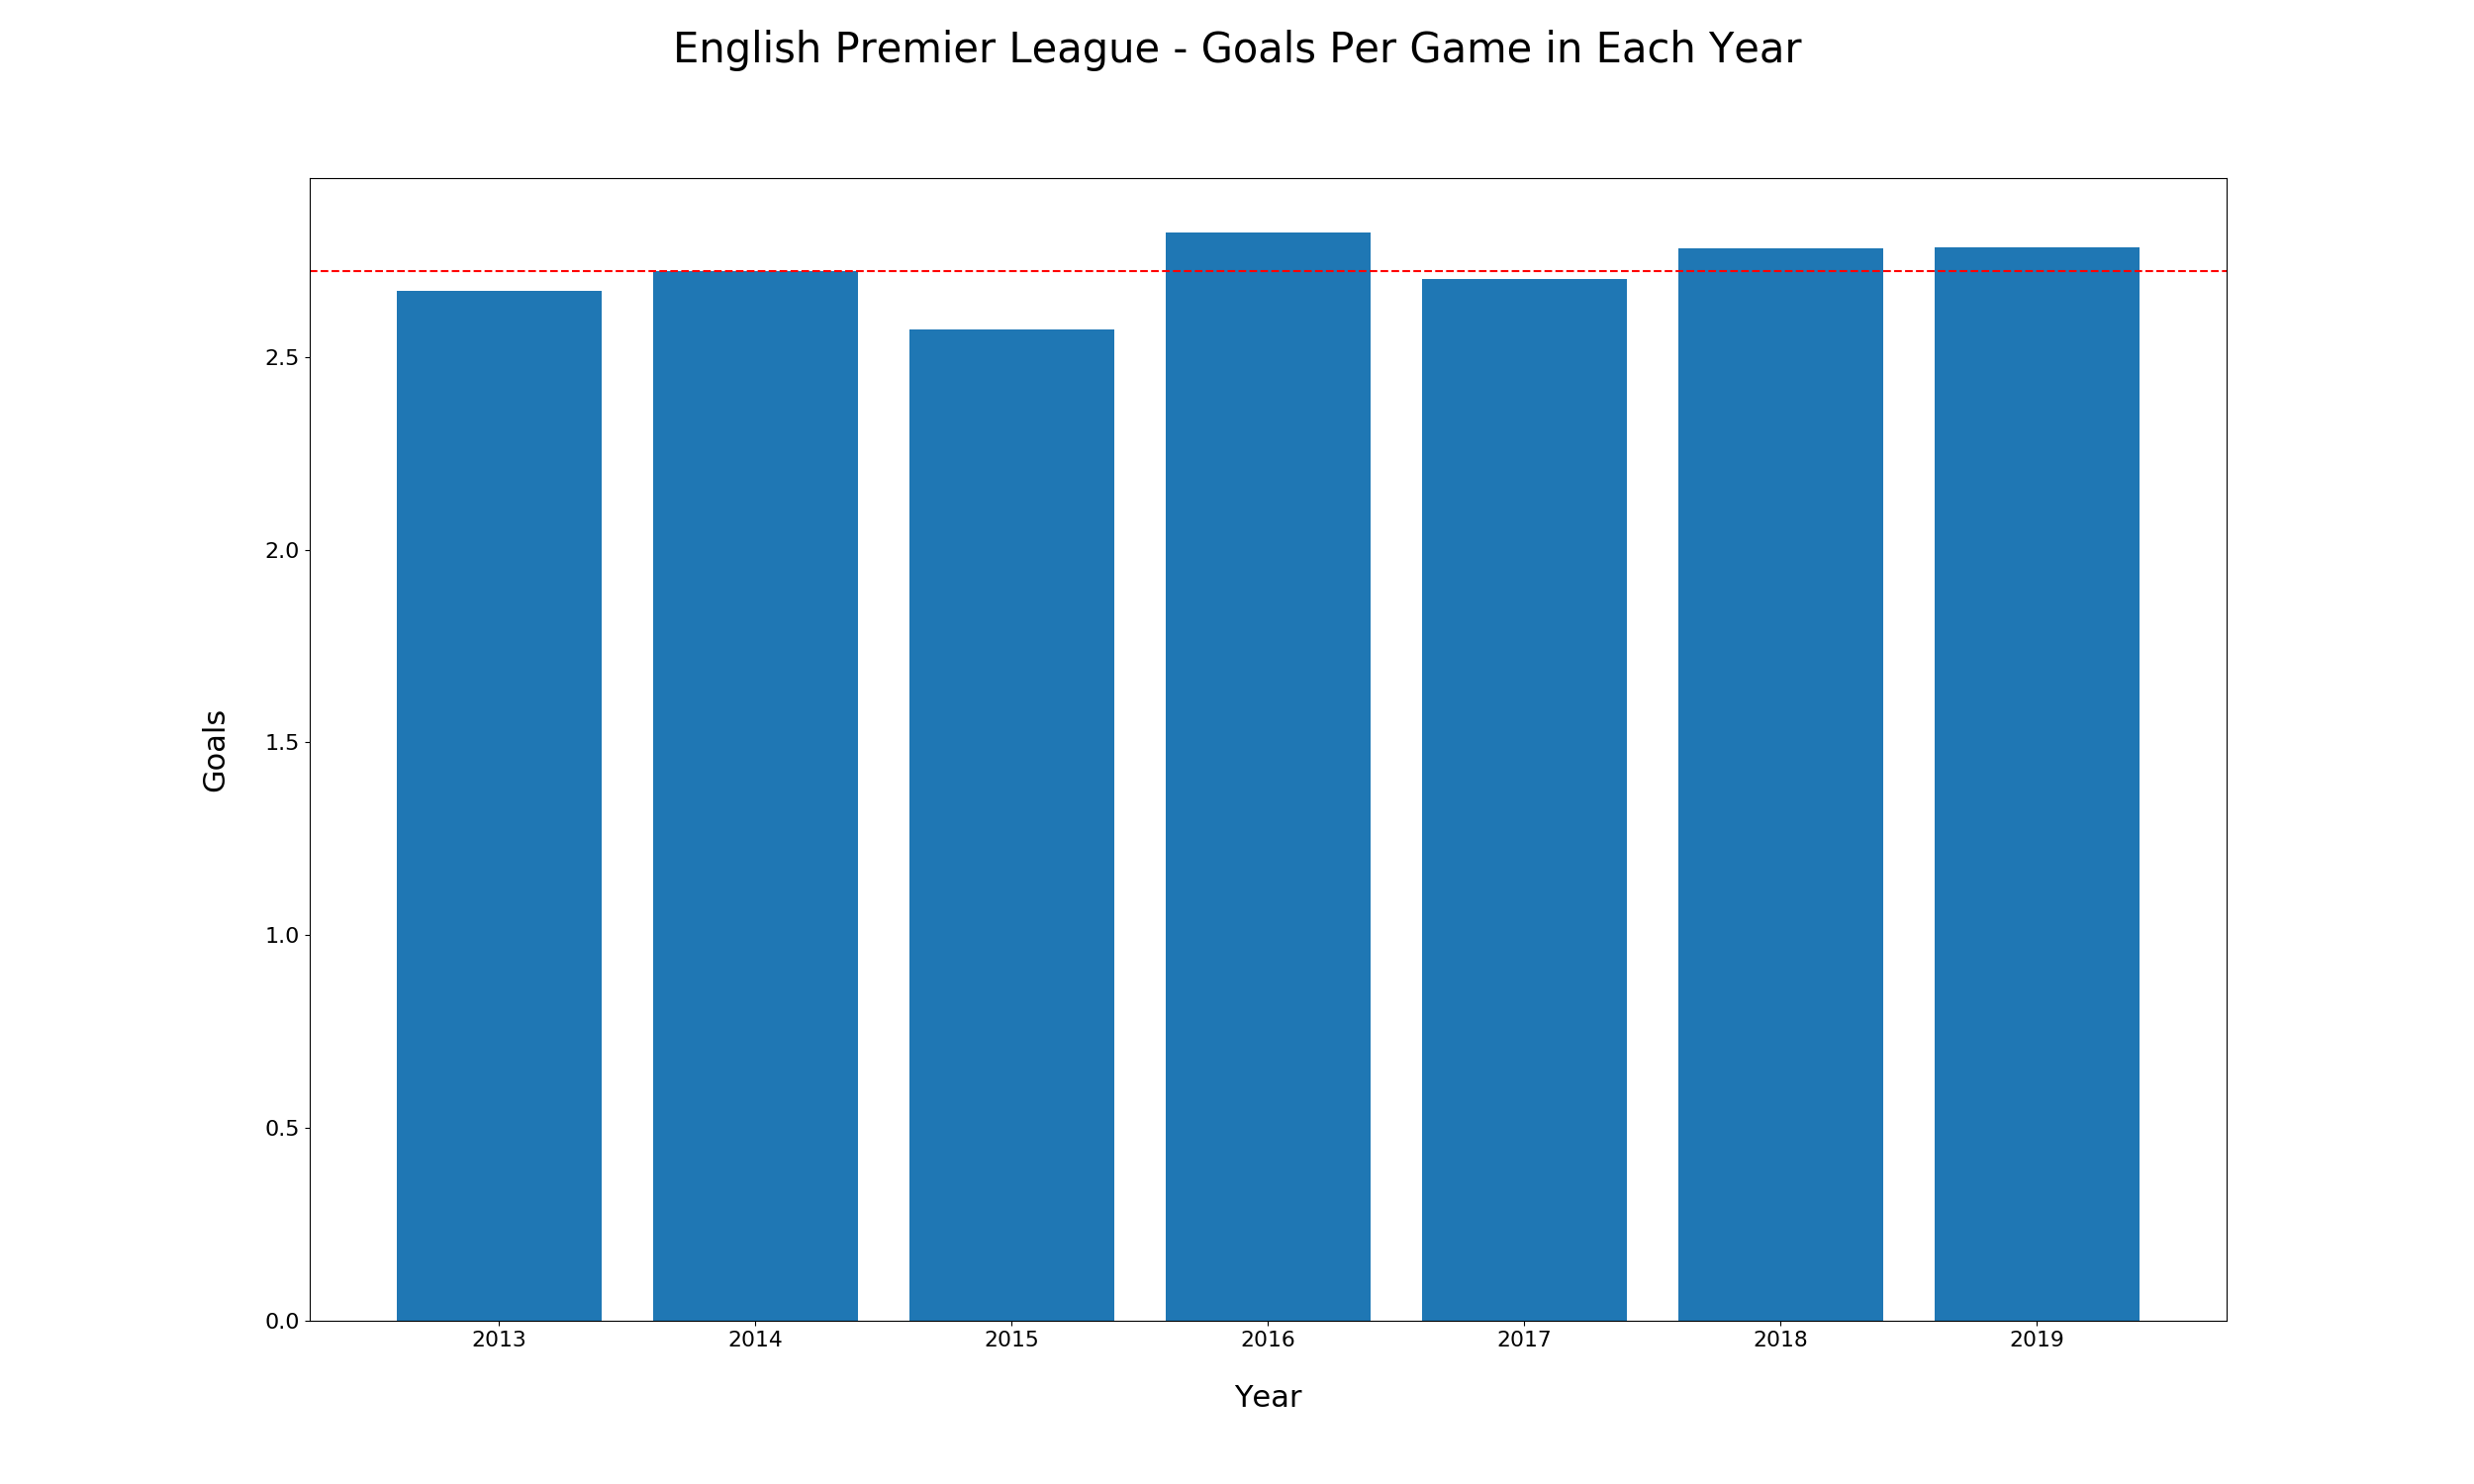
- Are there more goals in a World Cup match than an English Premier League match?
Instead of counting this manually, I again wrote a program, which is also available below, to read the scraped data and perform the analysis automatically.
Results
Looking at the data, it was clear that a breakdown of goals by minute would not be accurate enough. There simply wasn't enough data from past World Cups to look at a breakdown minute-by-minute. The variability meant any individual minute would not be statistically significant over others.
Instead, I looked at the data by 5-minute and 9-minute intervals, as well as by quarter and half. And without further adieu, these were the results:
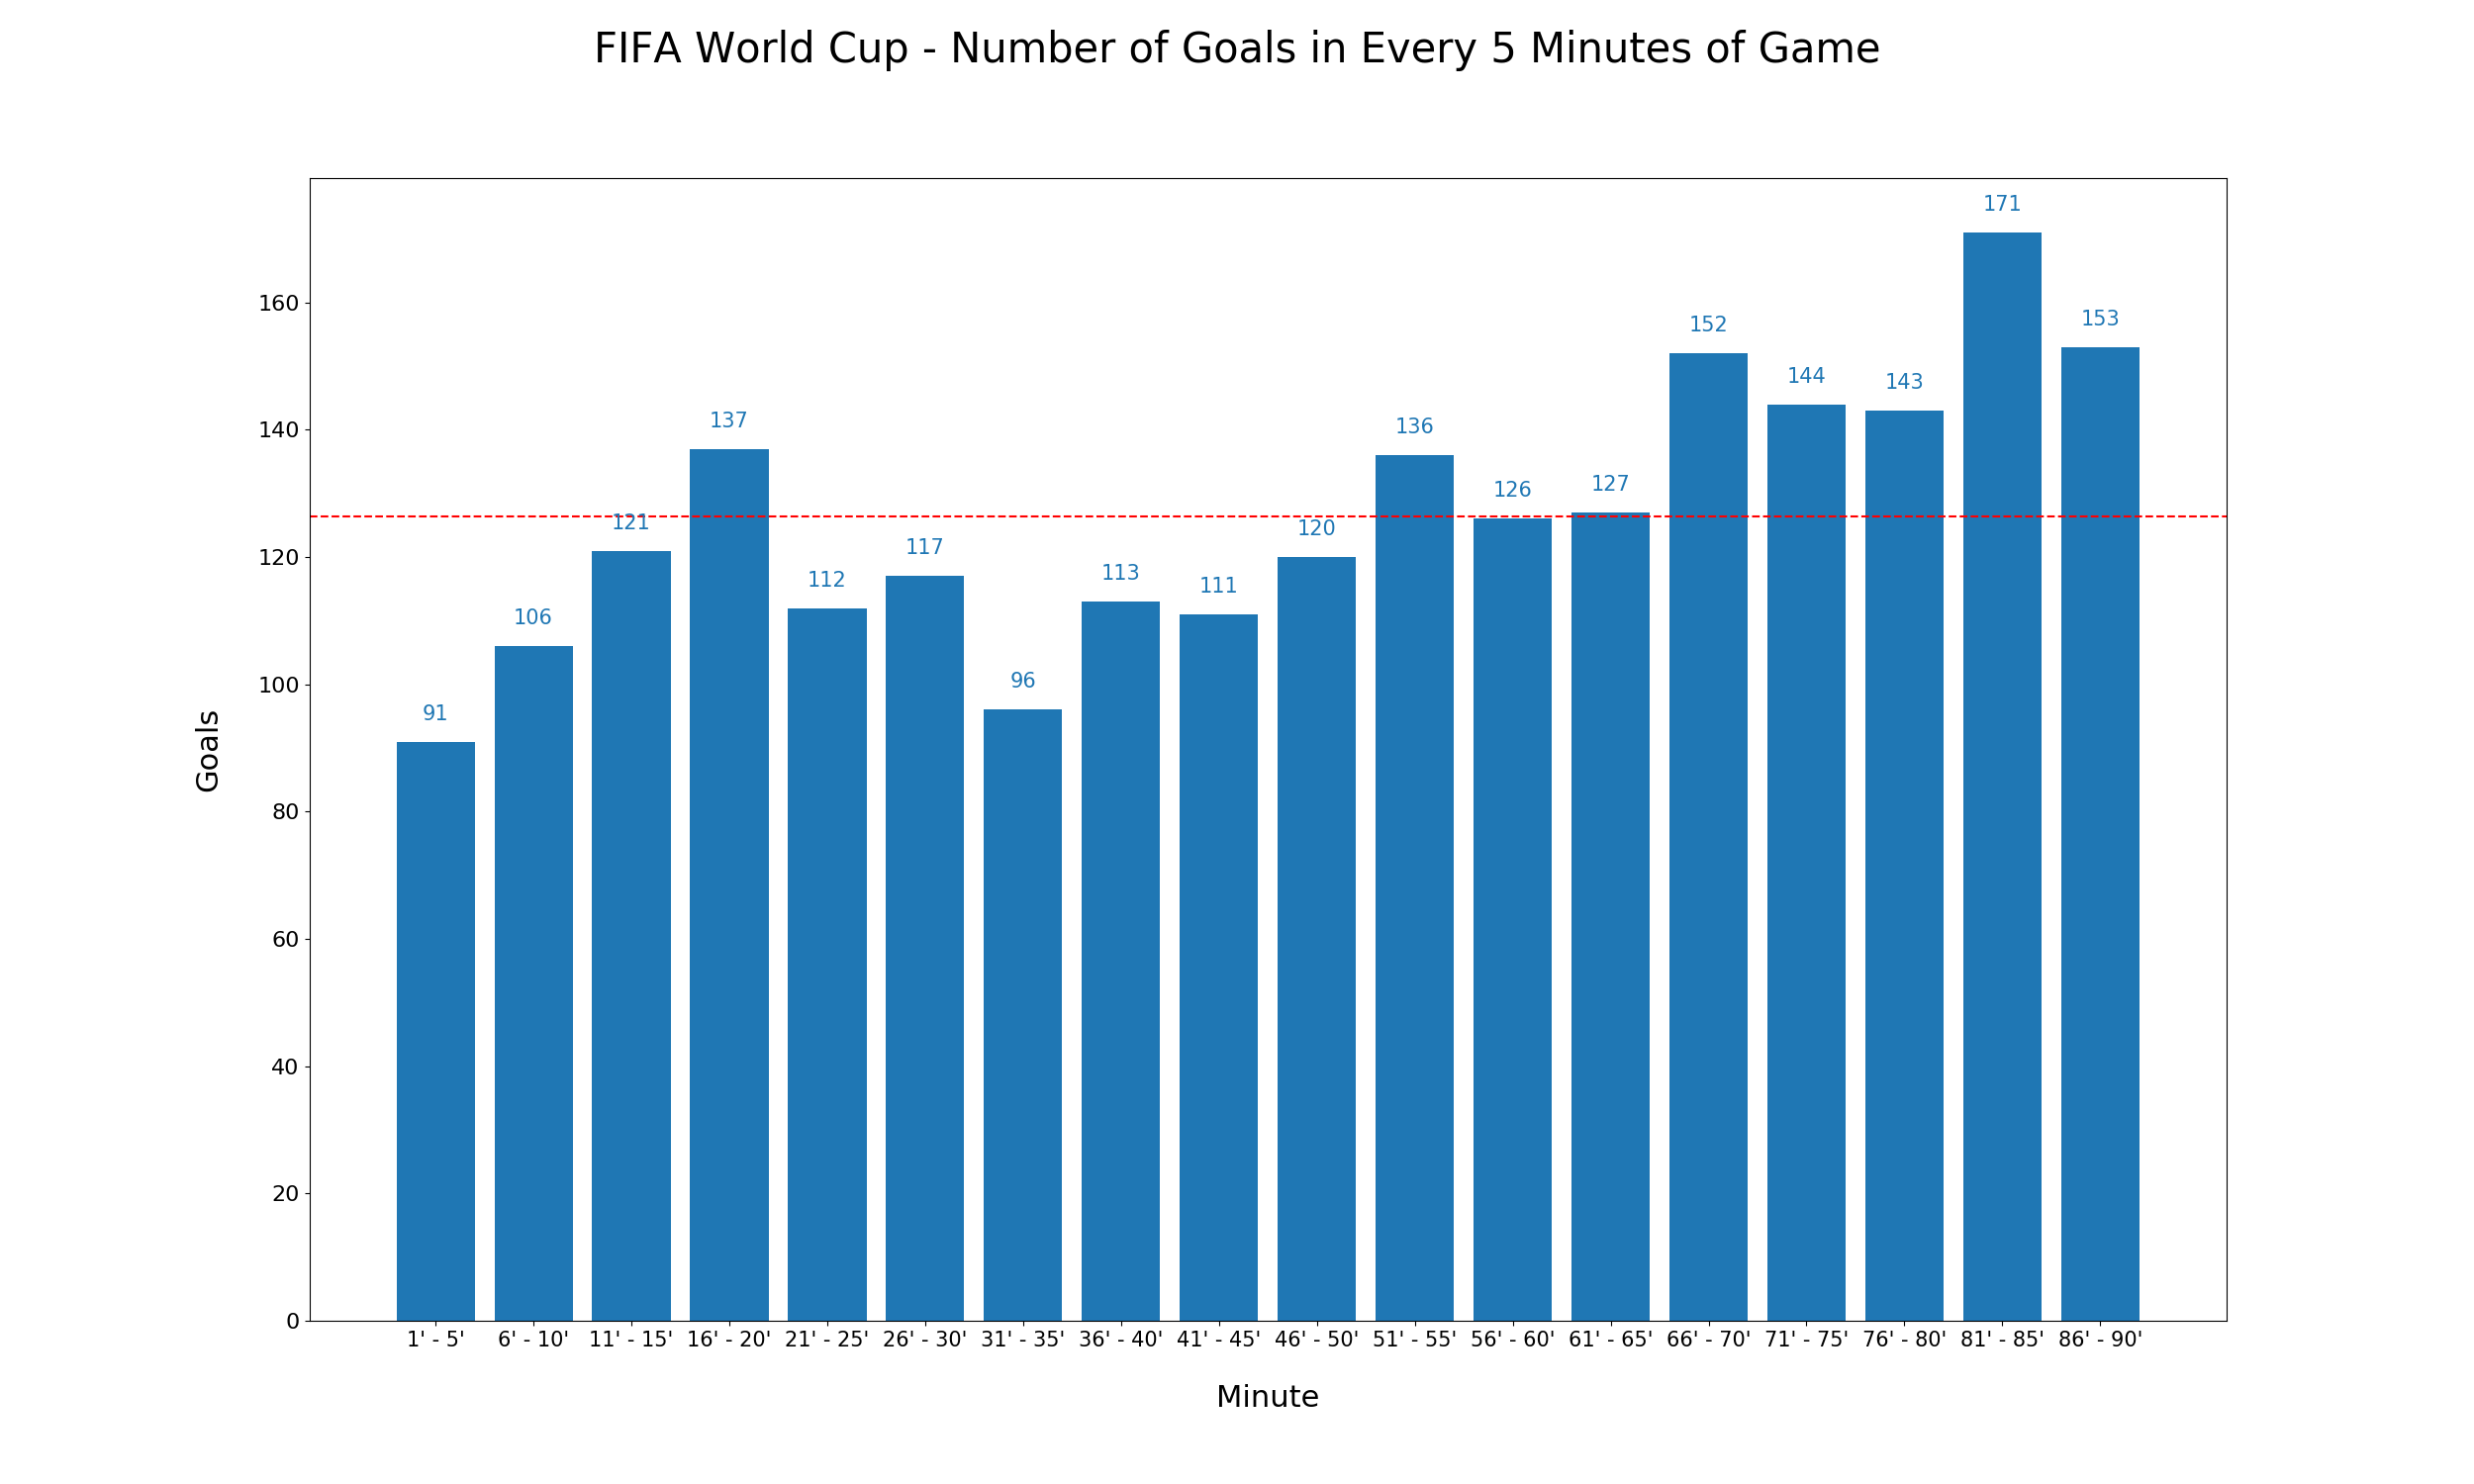
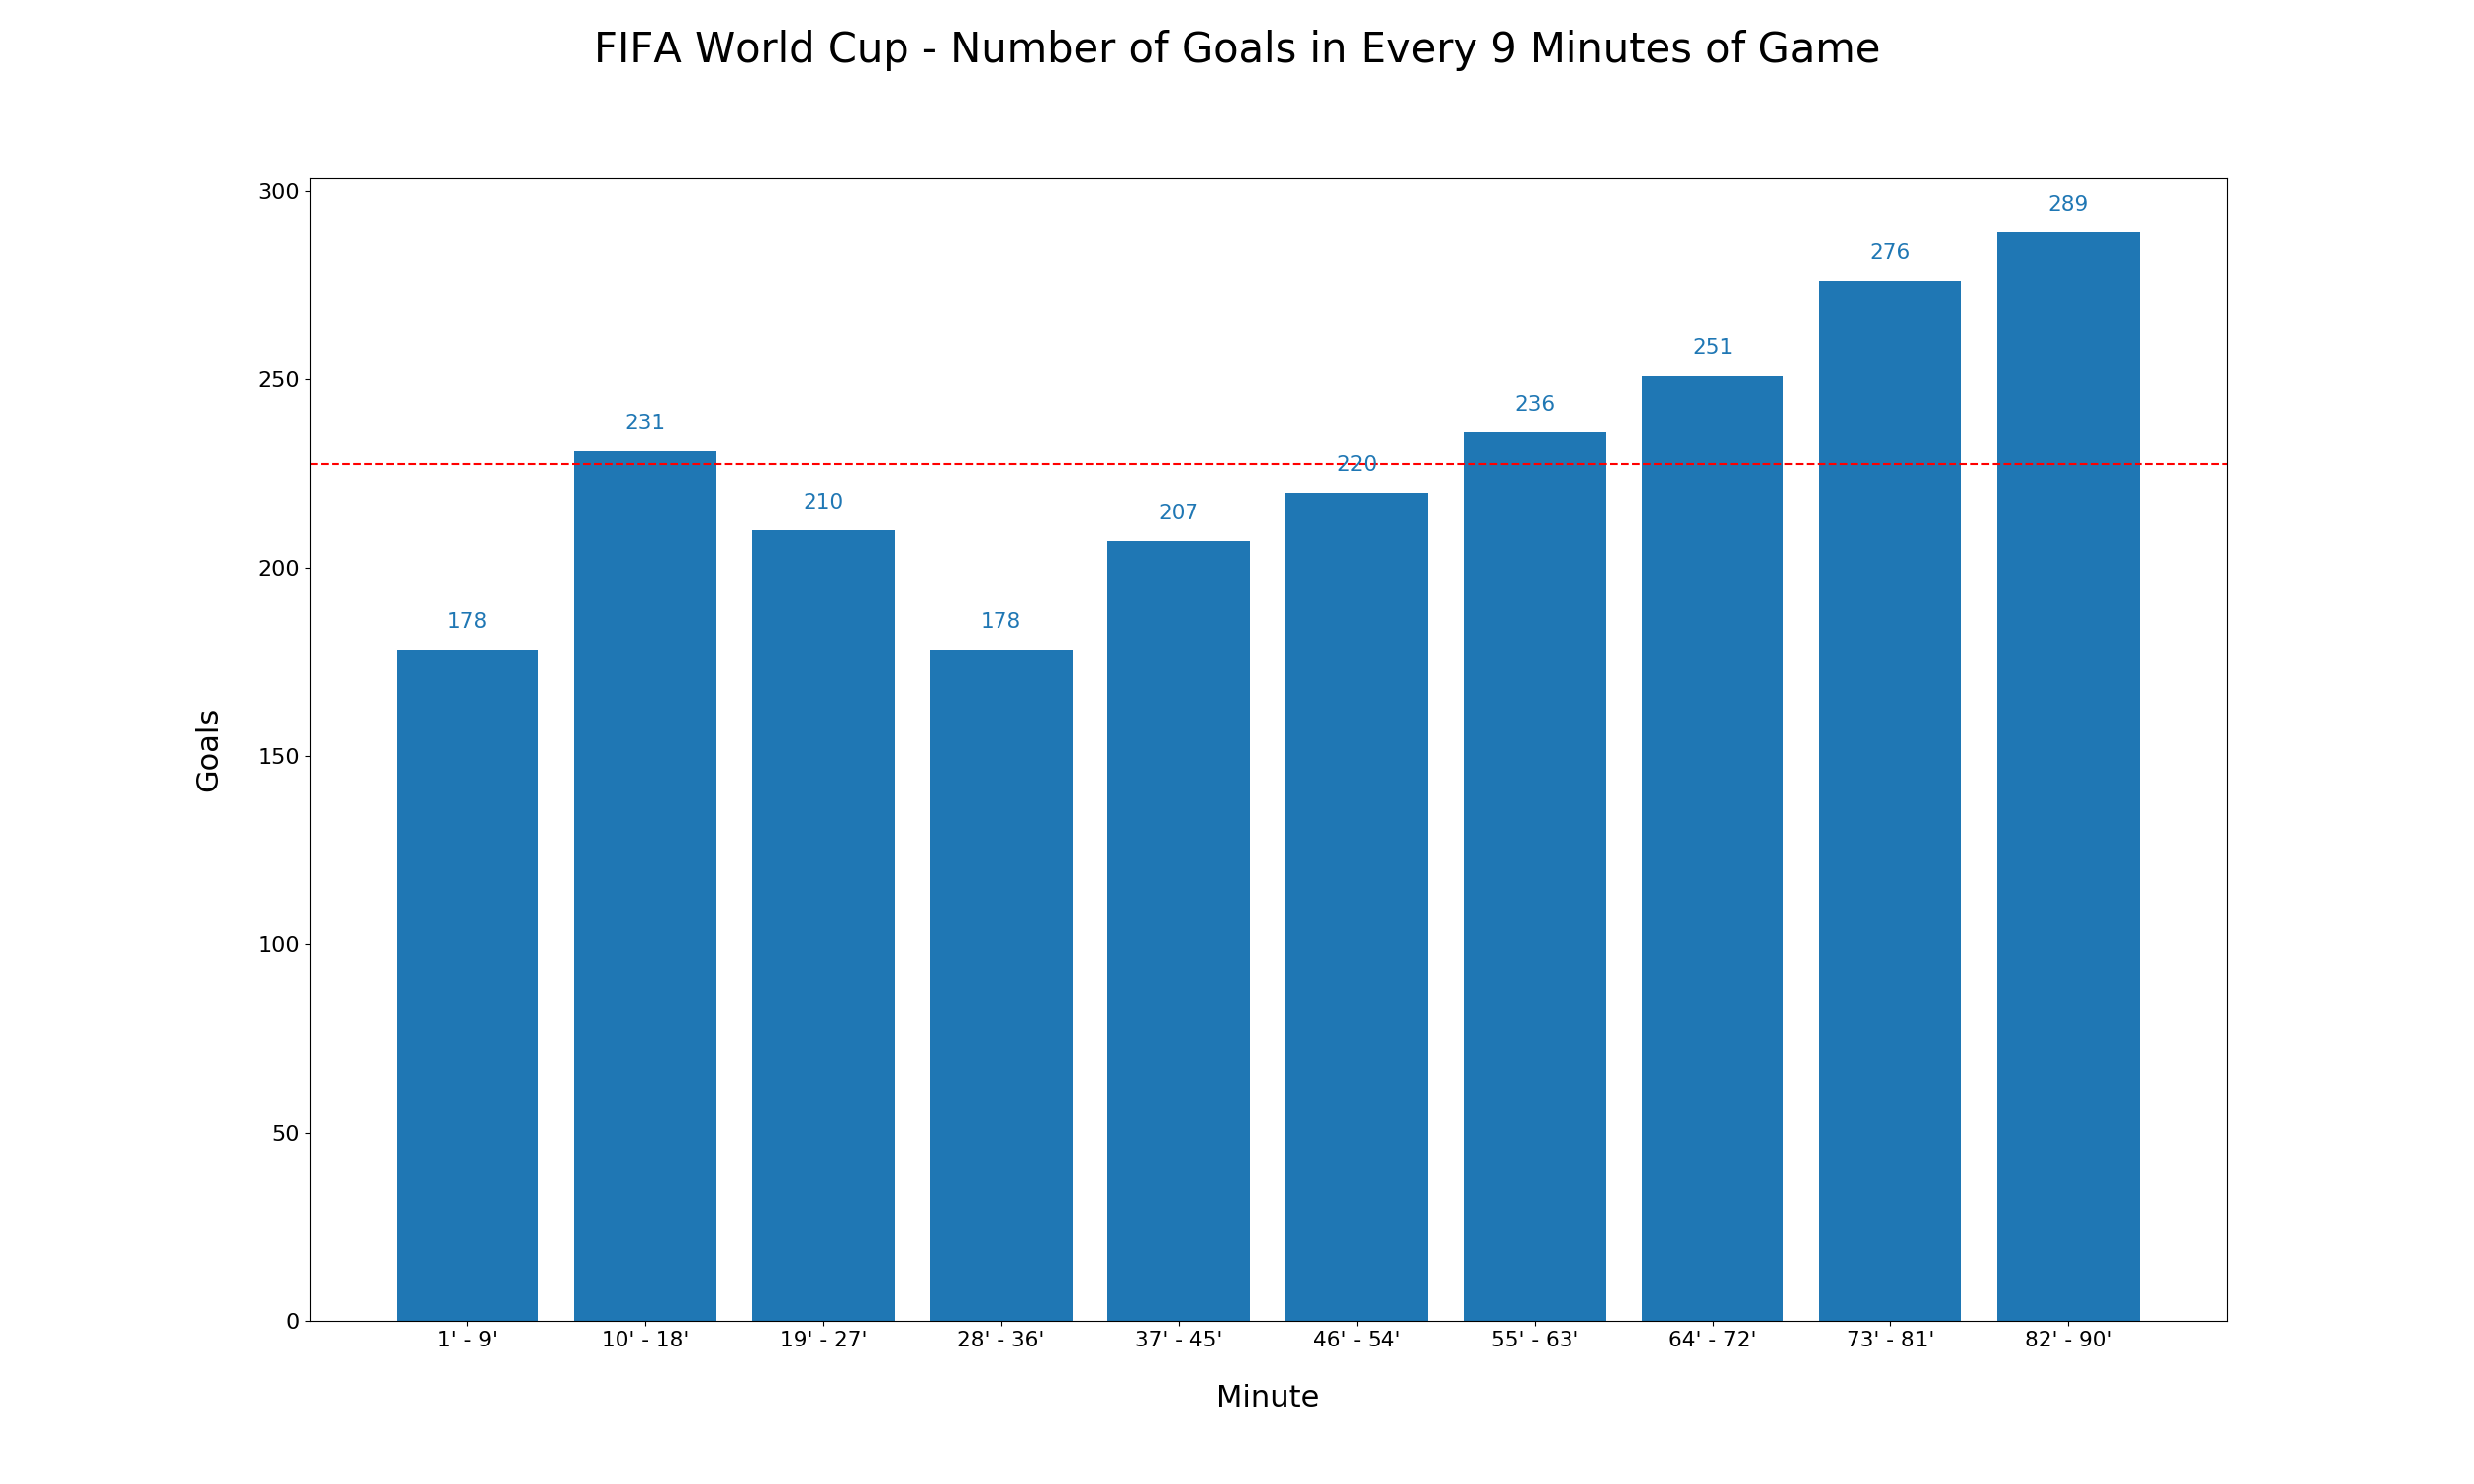
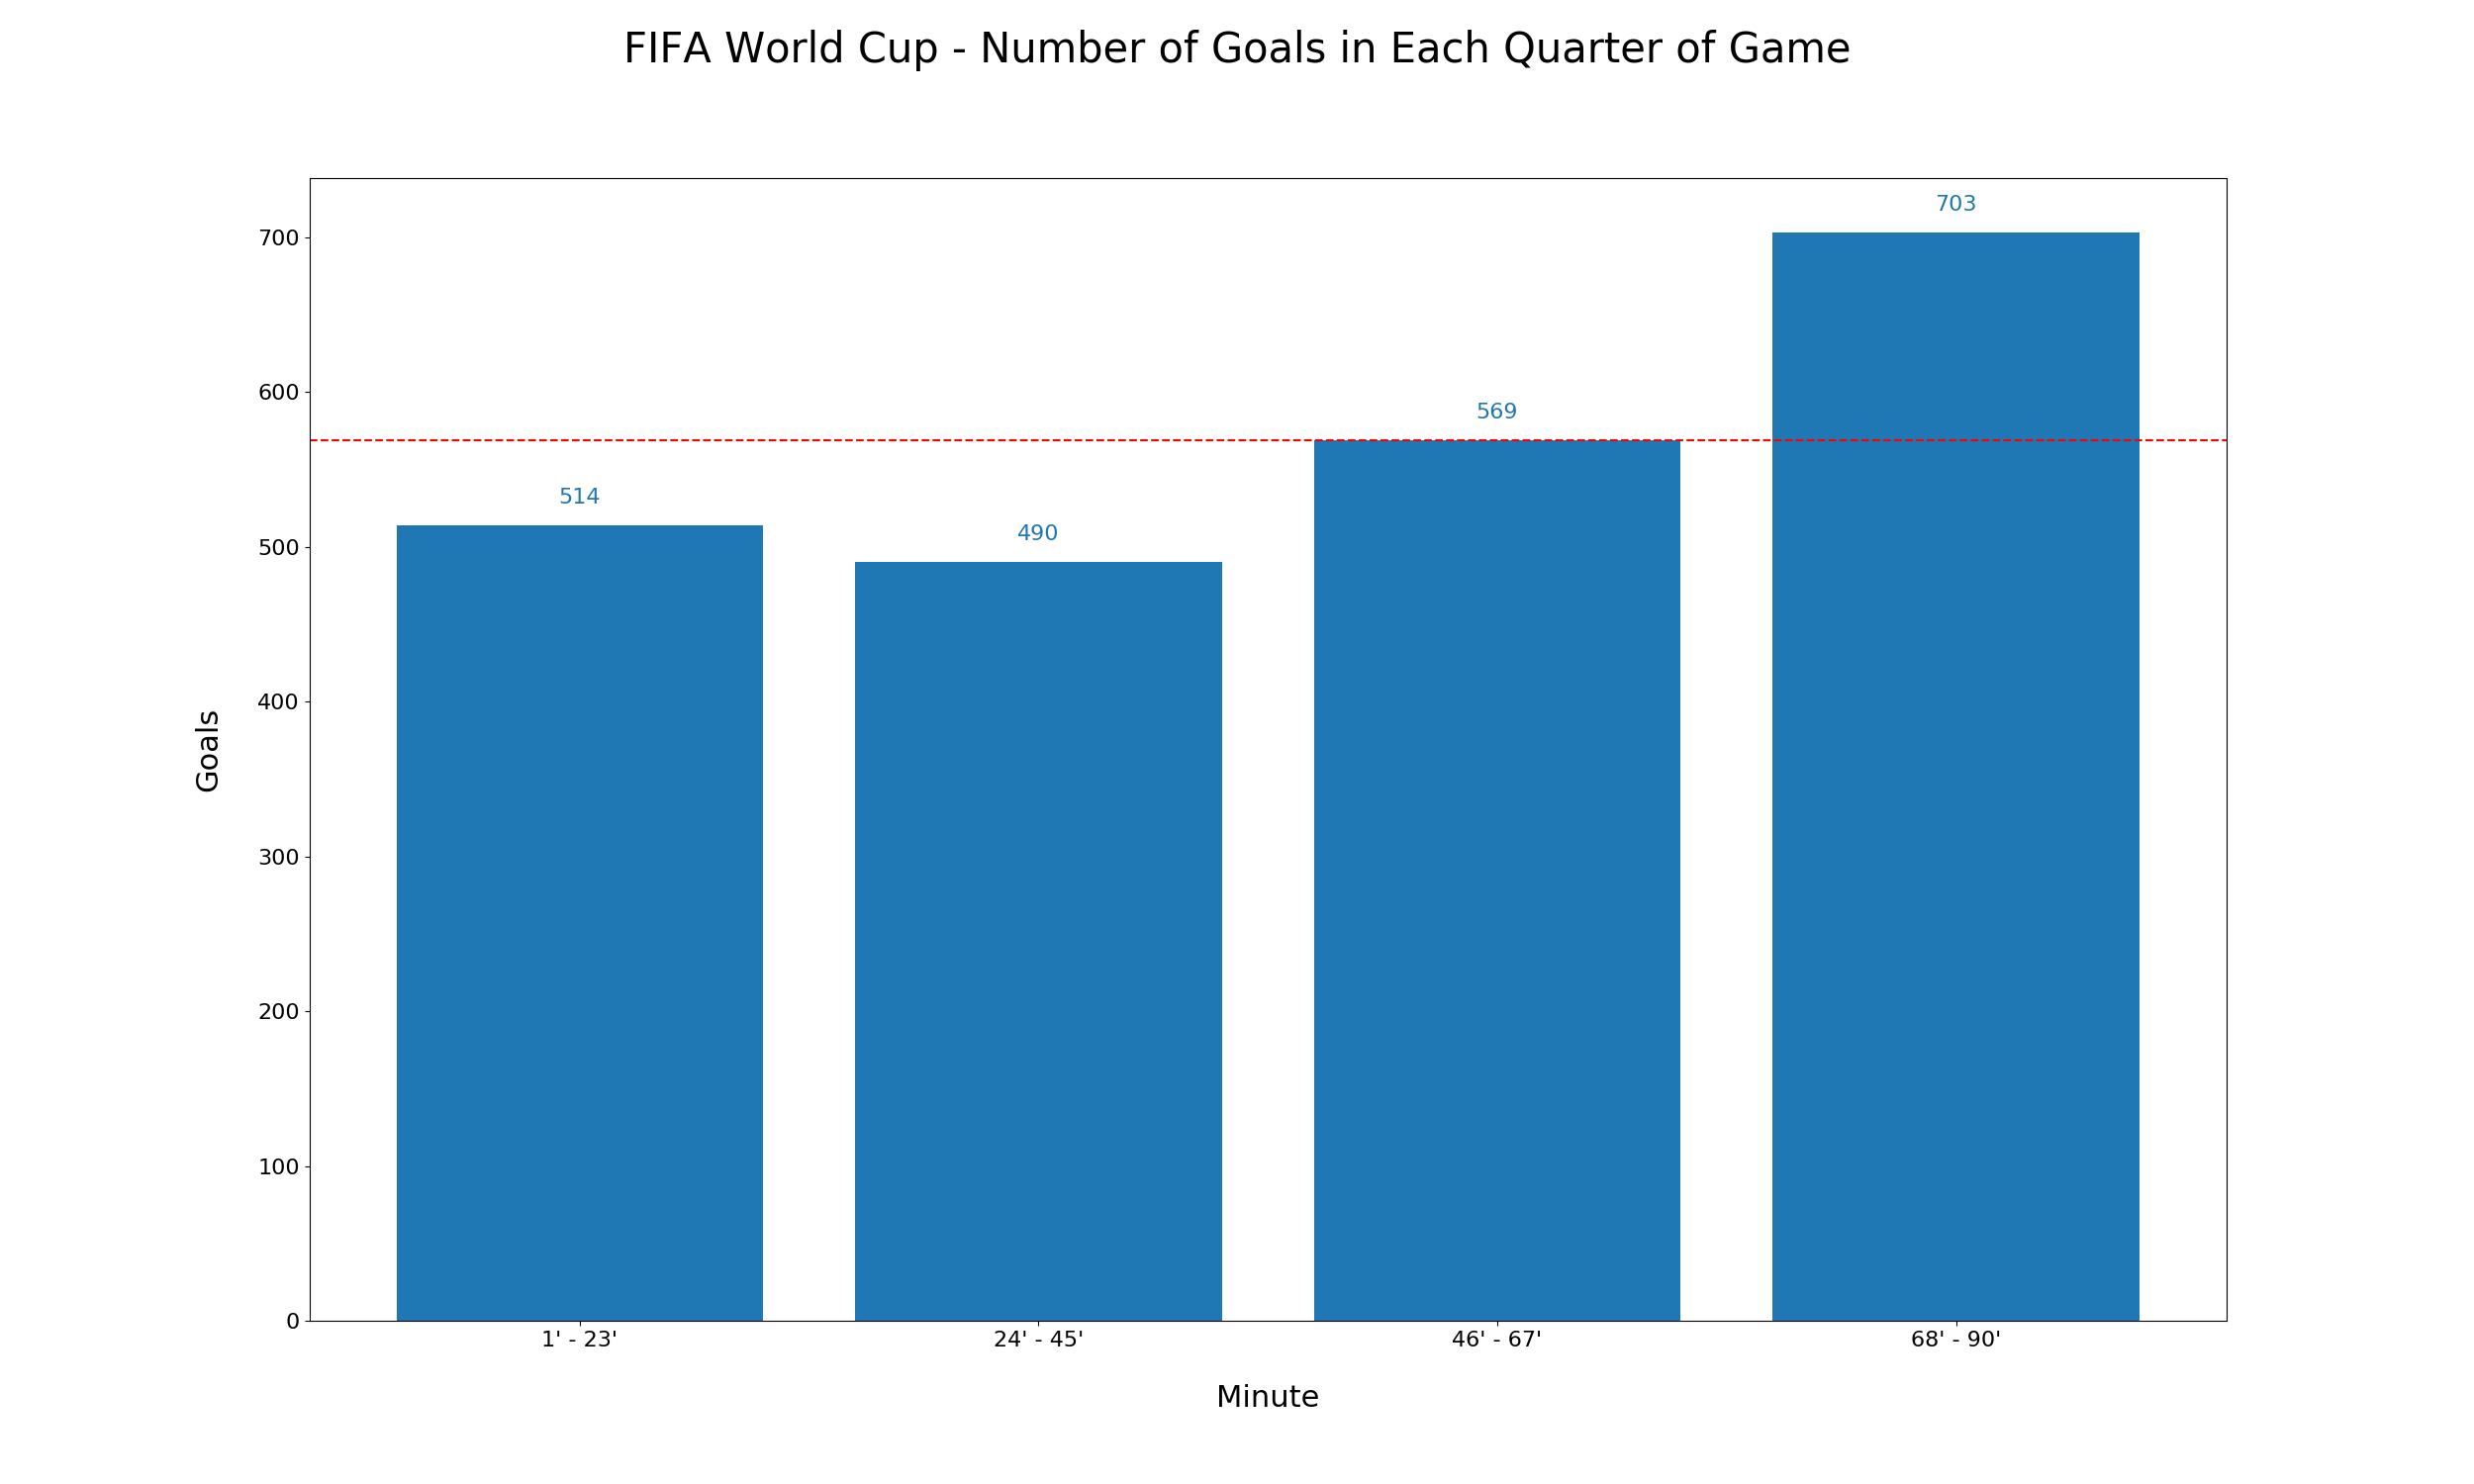
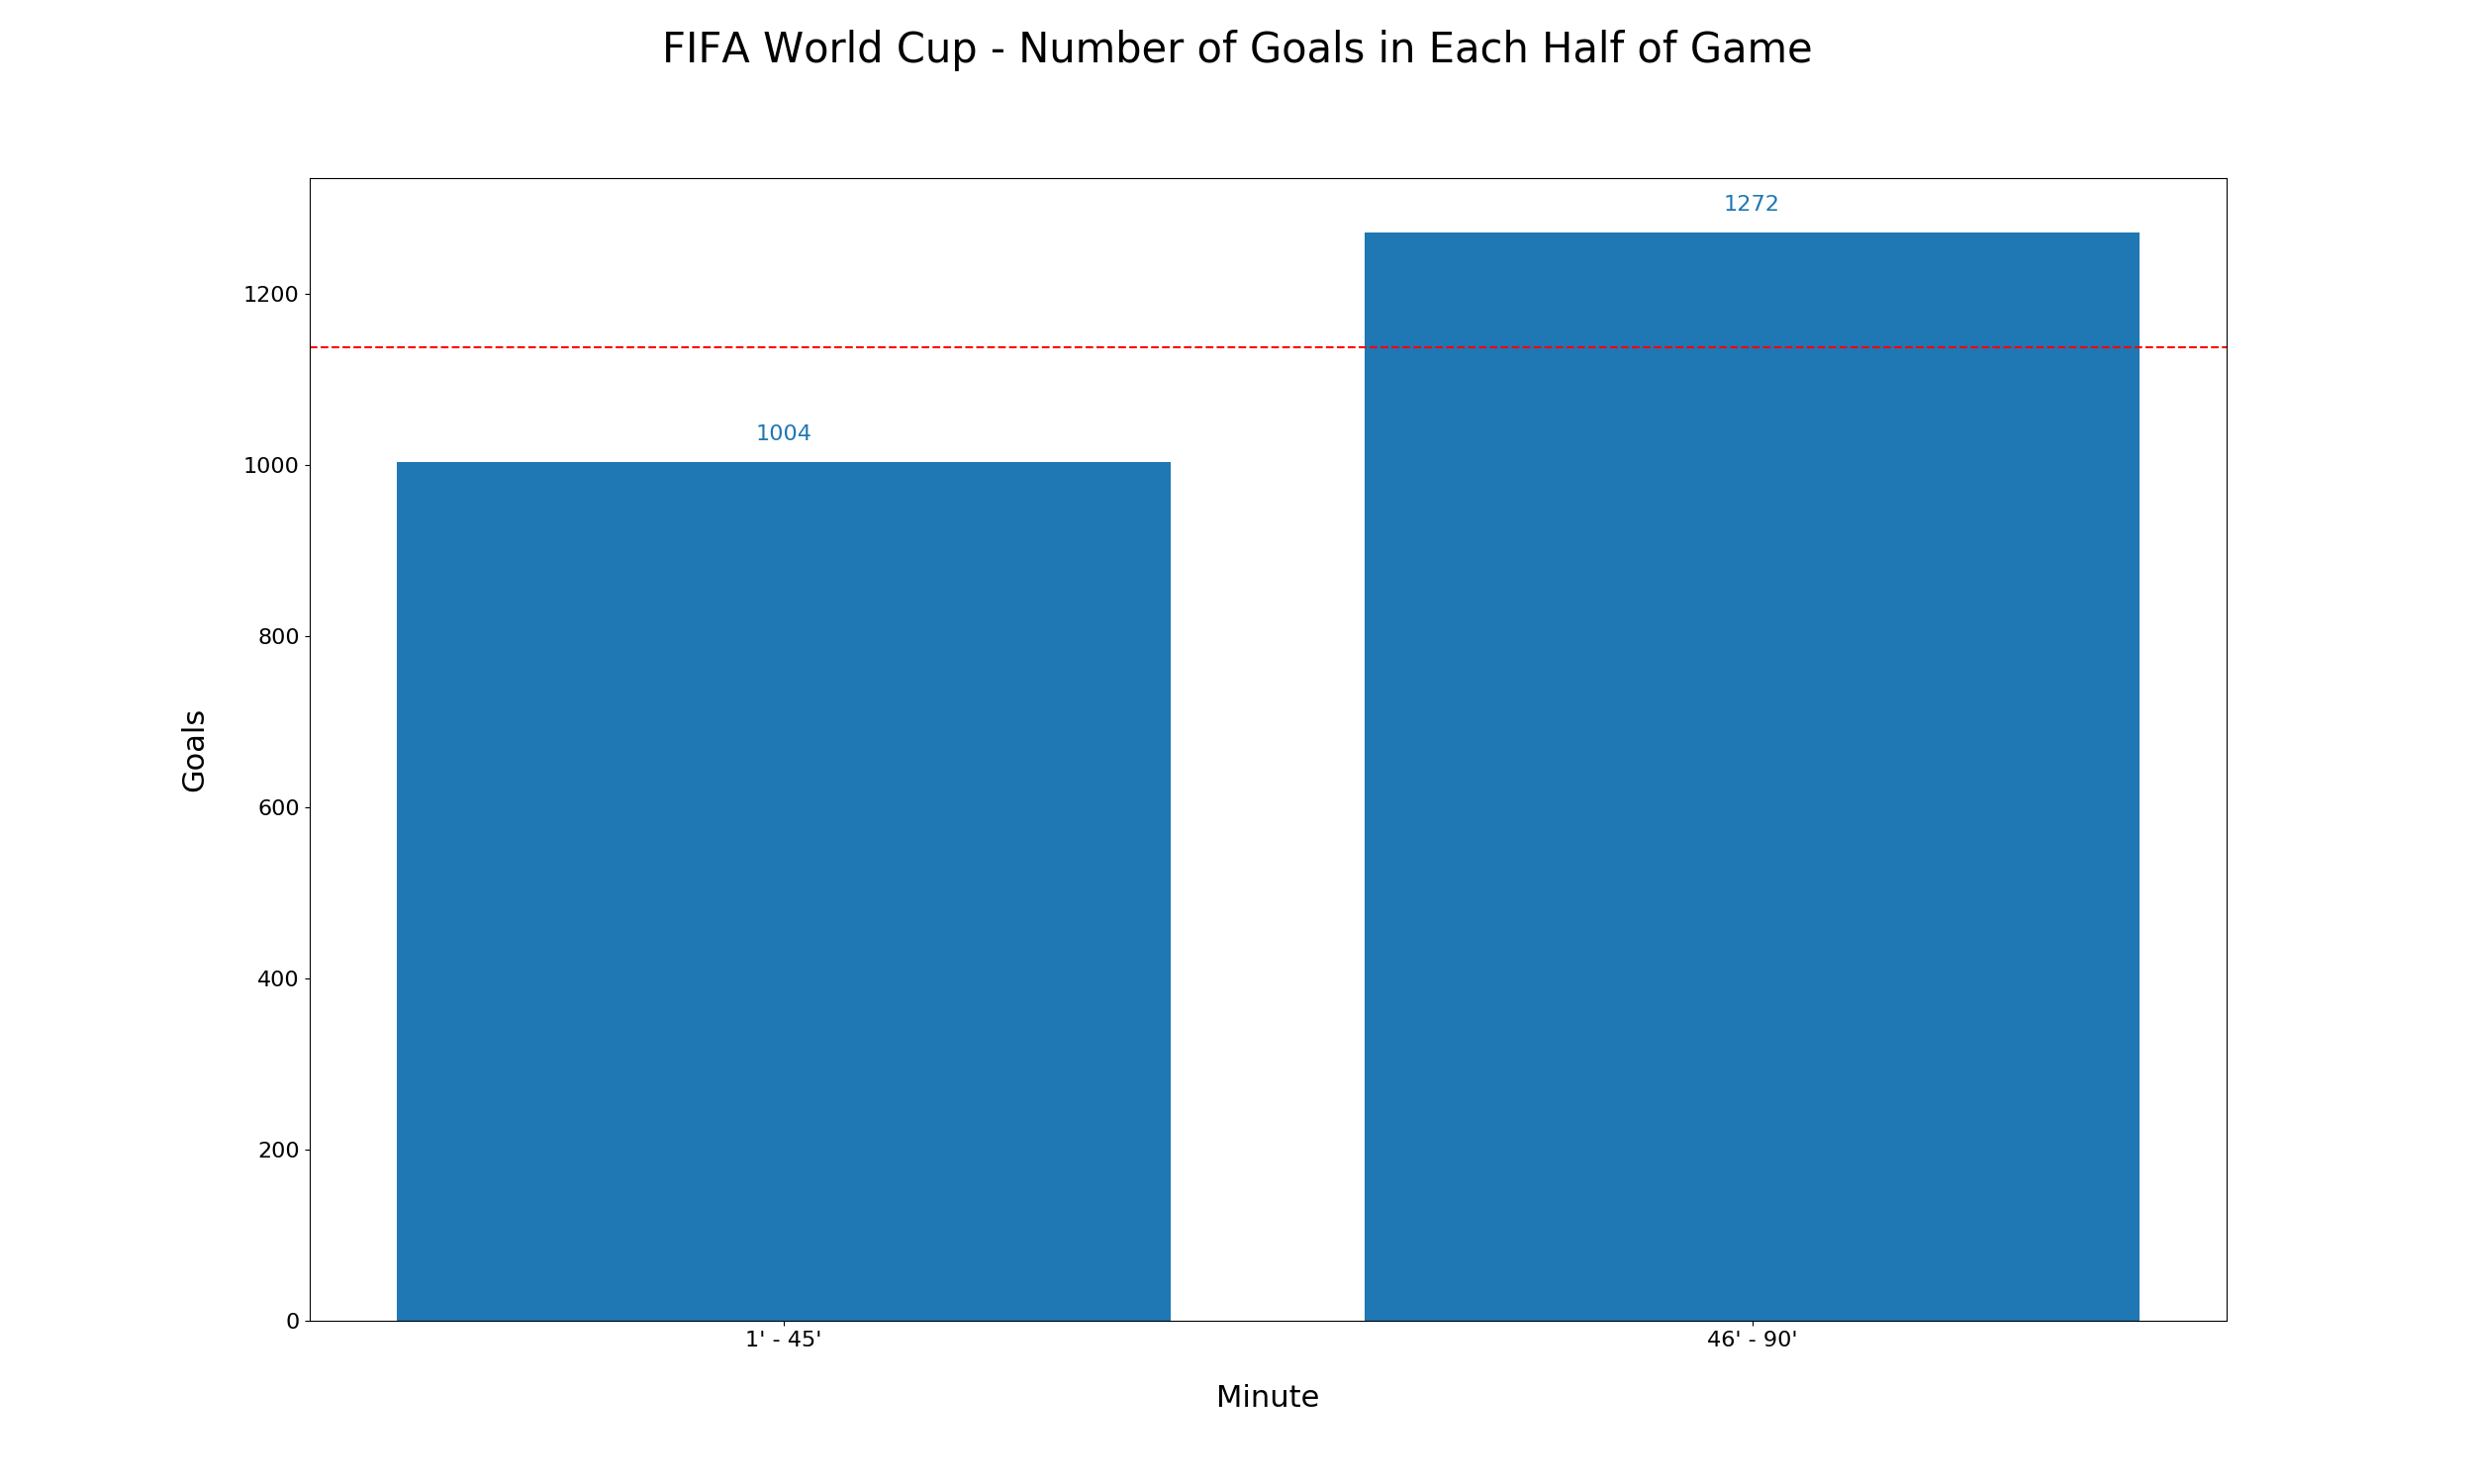
There seemed to be a tendency for goals to be scored in the final minutes of the game. From the data, it appeared that goals are most scored in the 81st-85th minutes at 5-minute intervals, 81st-90th minutes at 9-minute intervals, and the final quarter or half at those intervals.
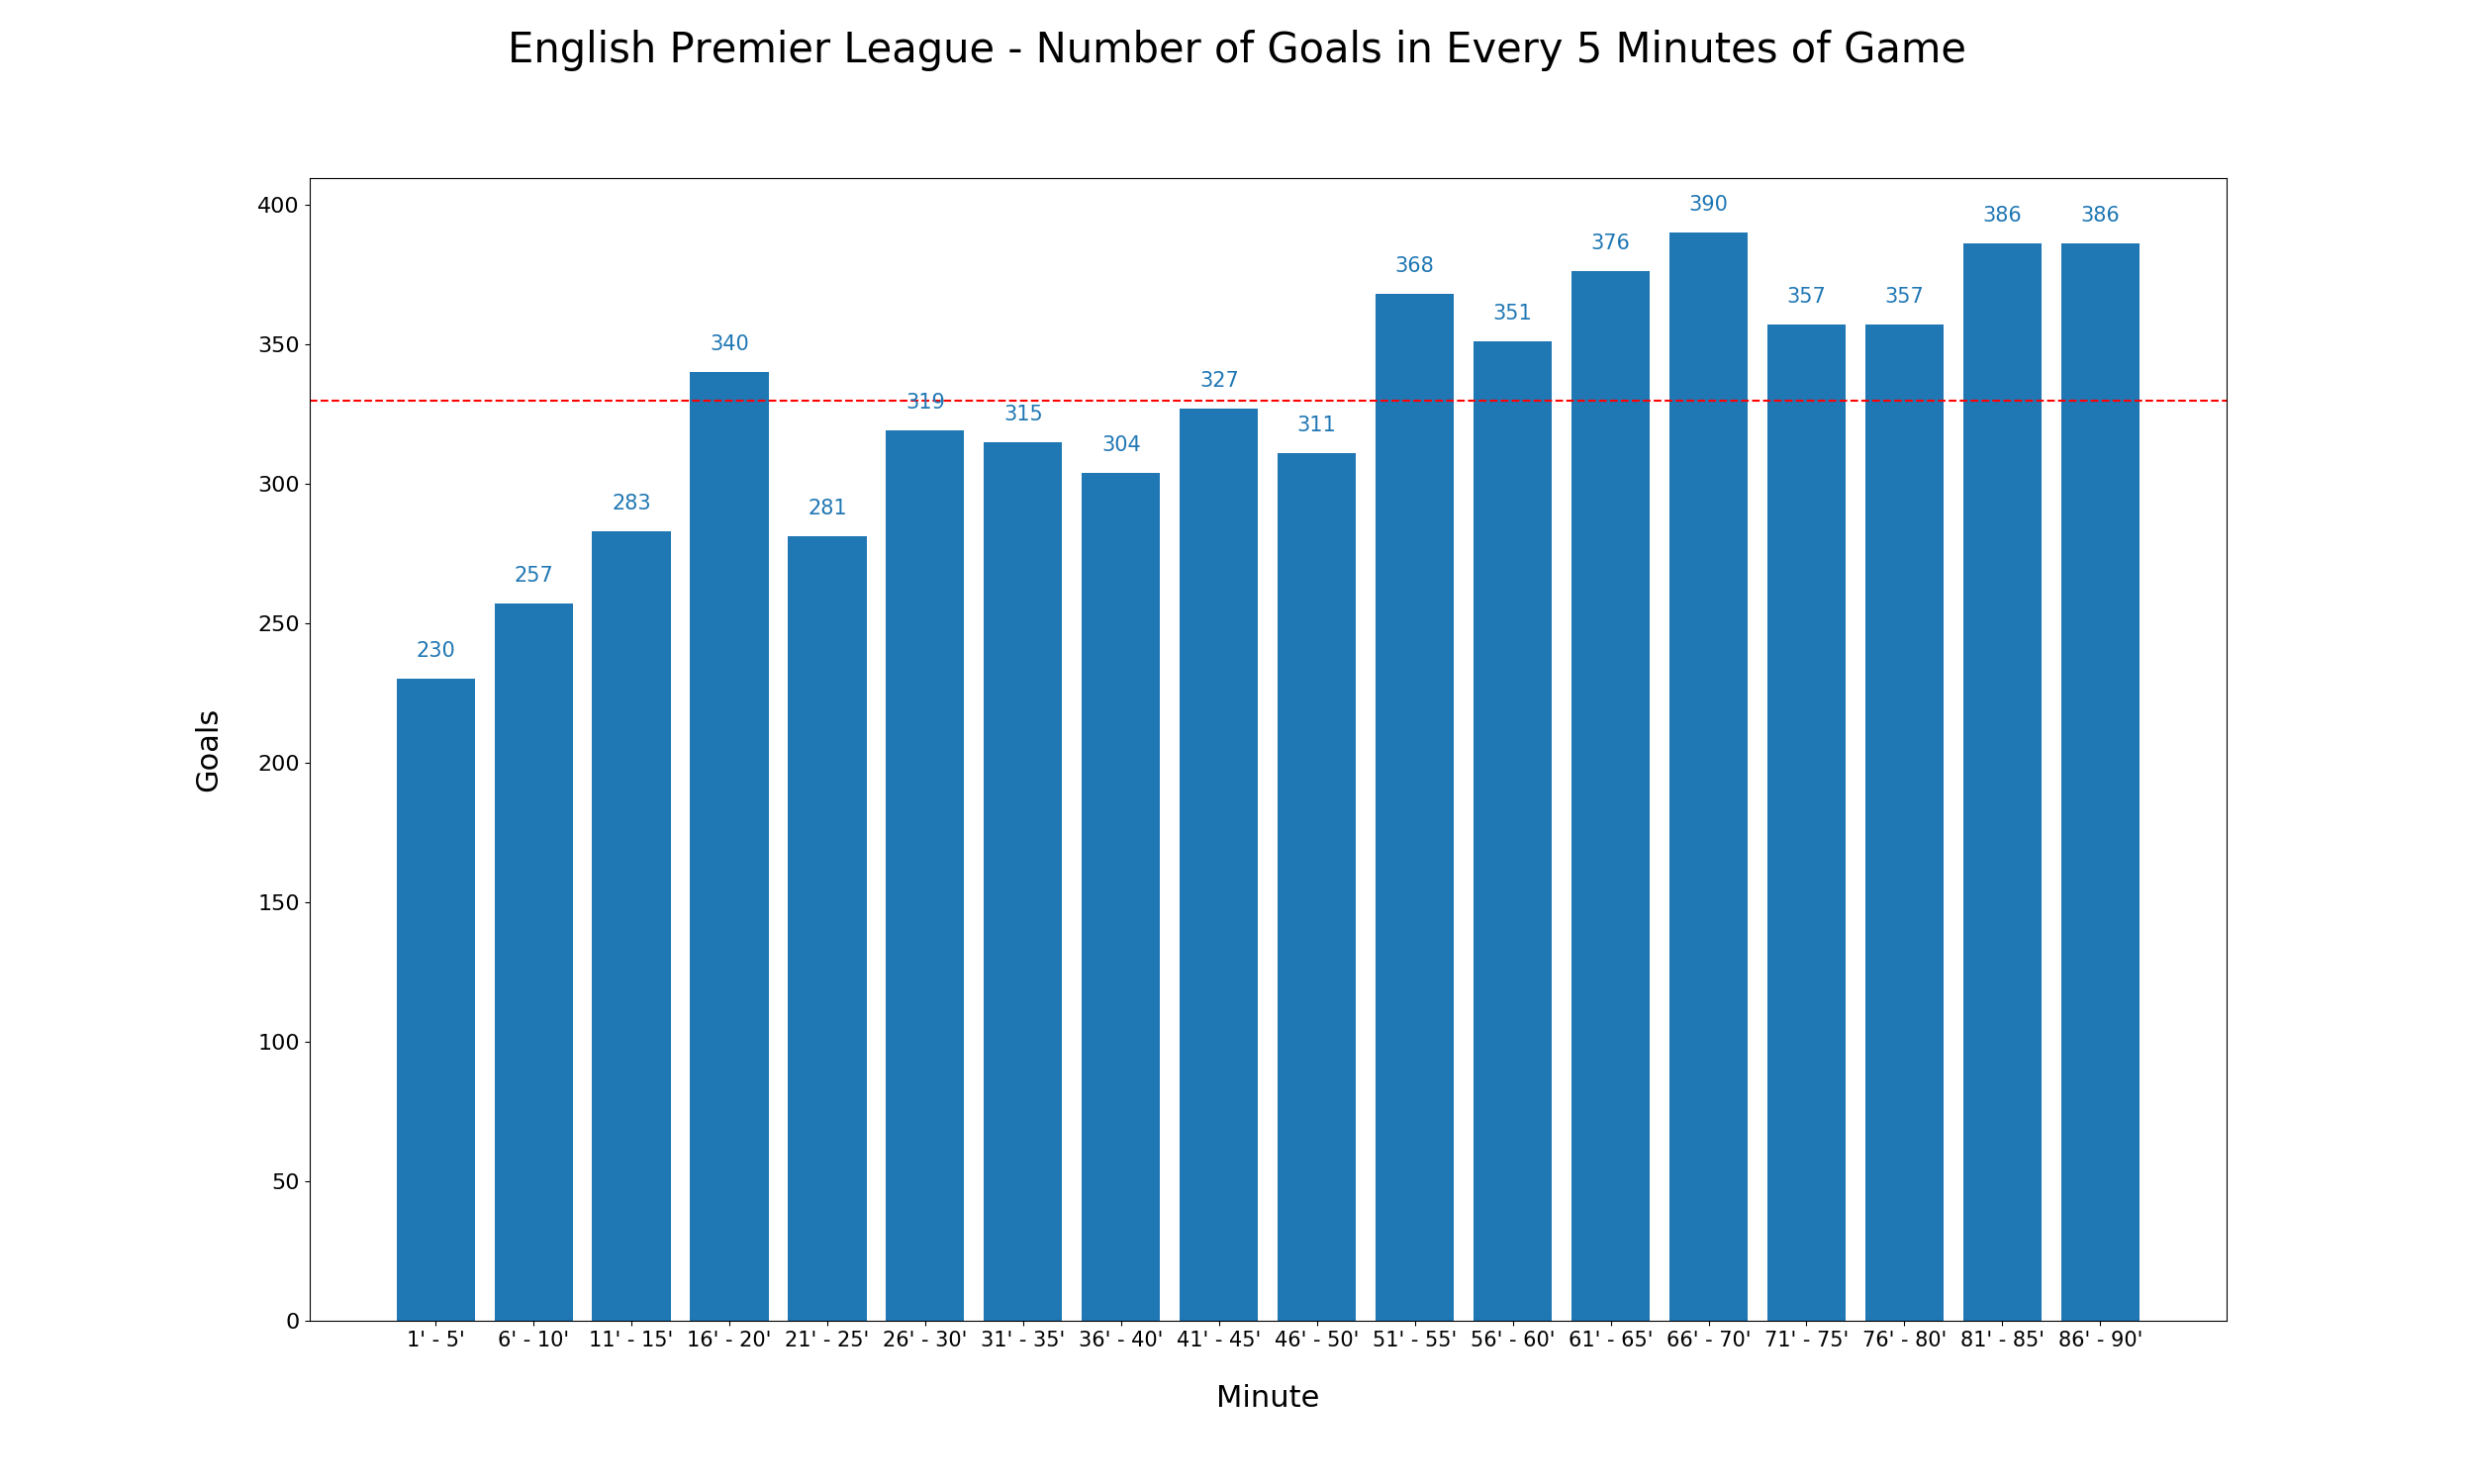
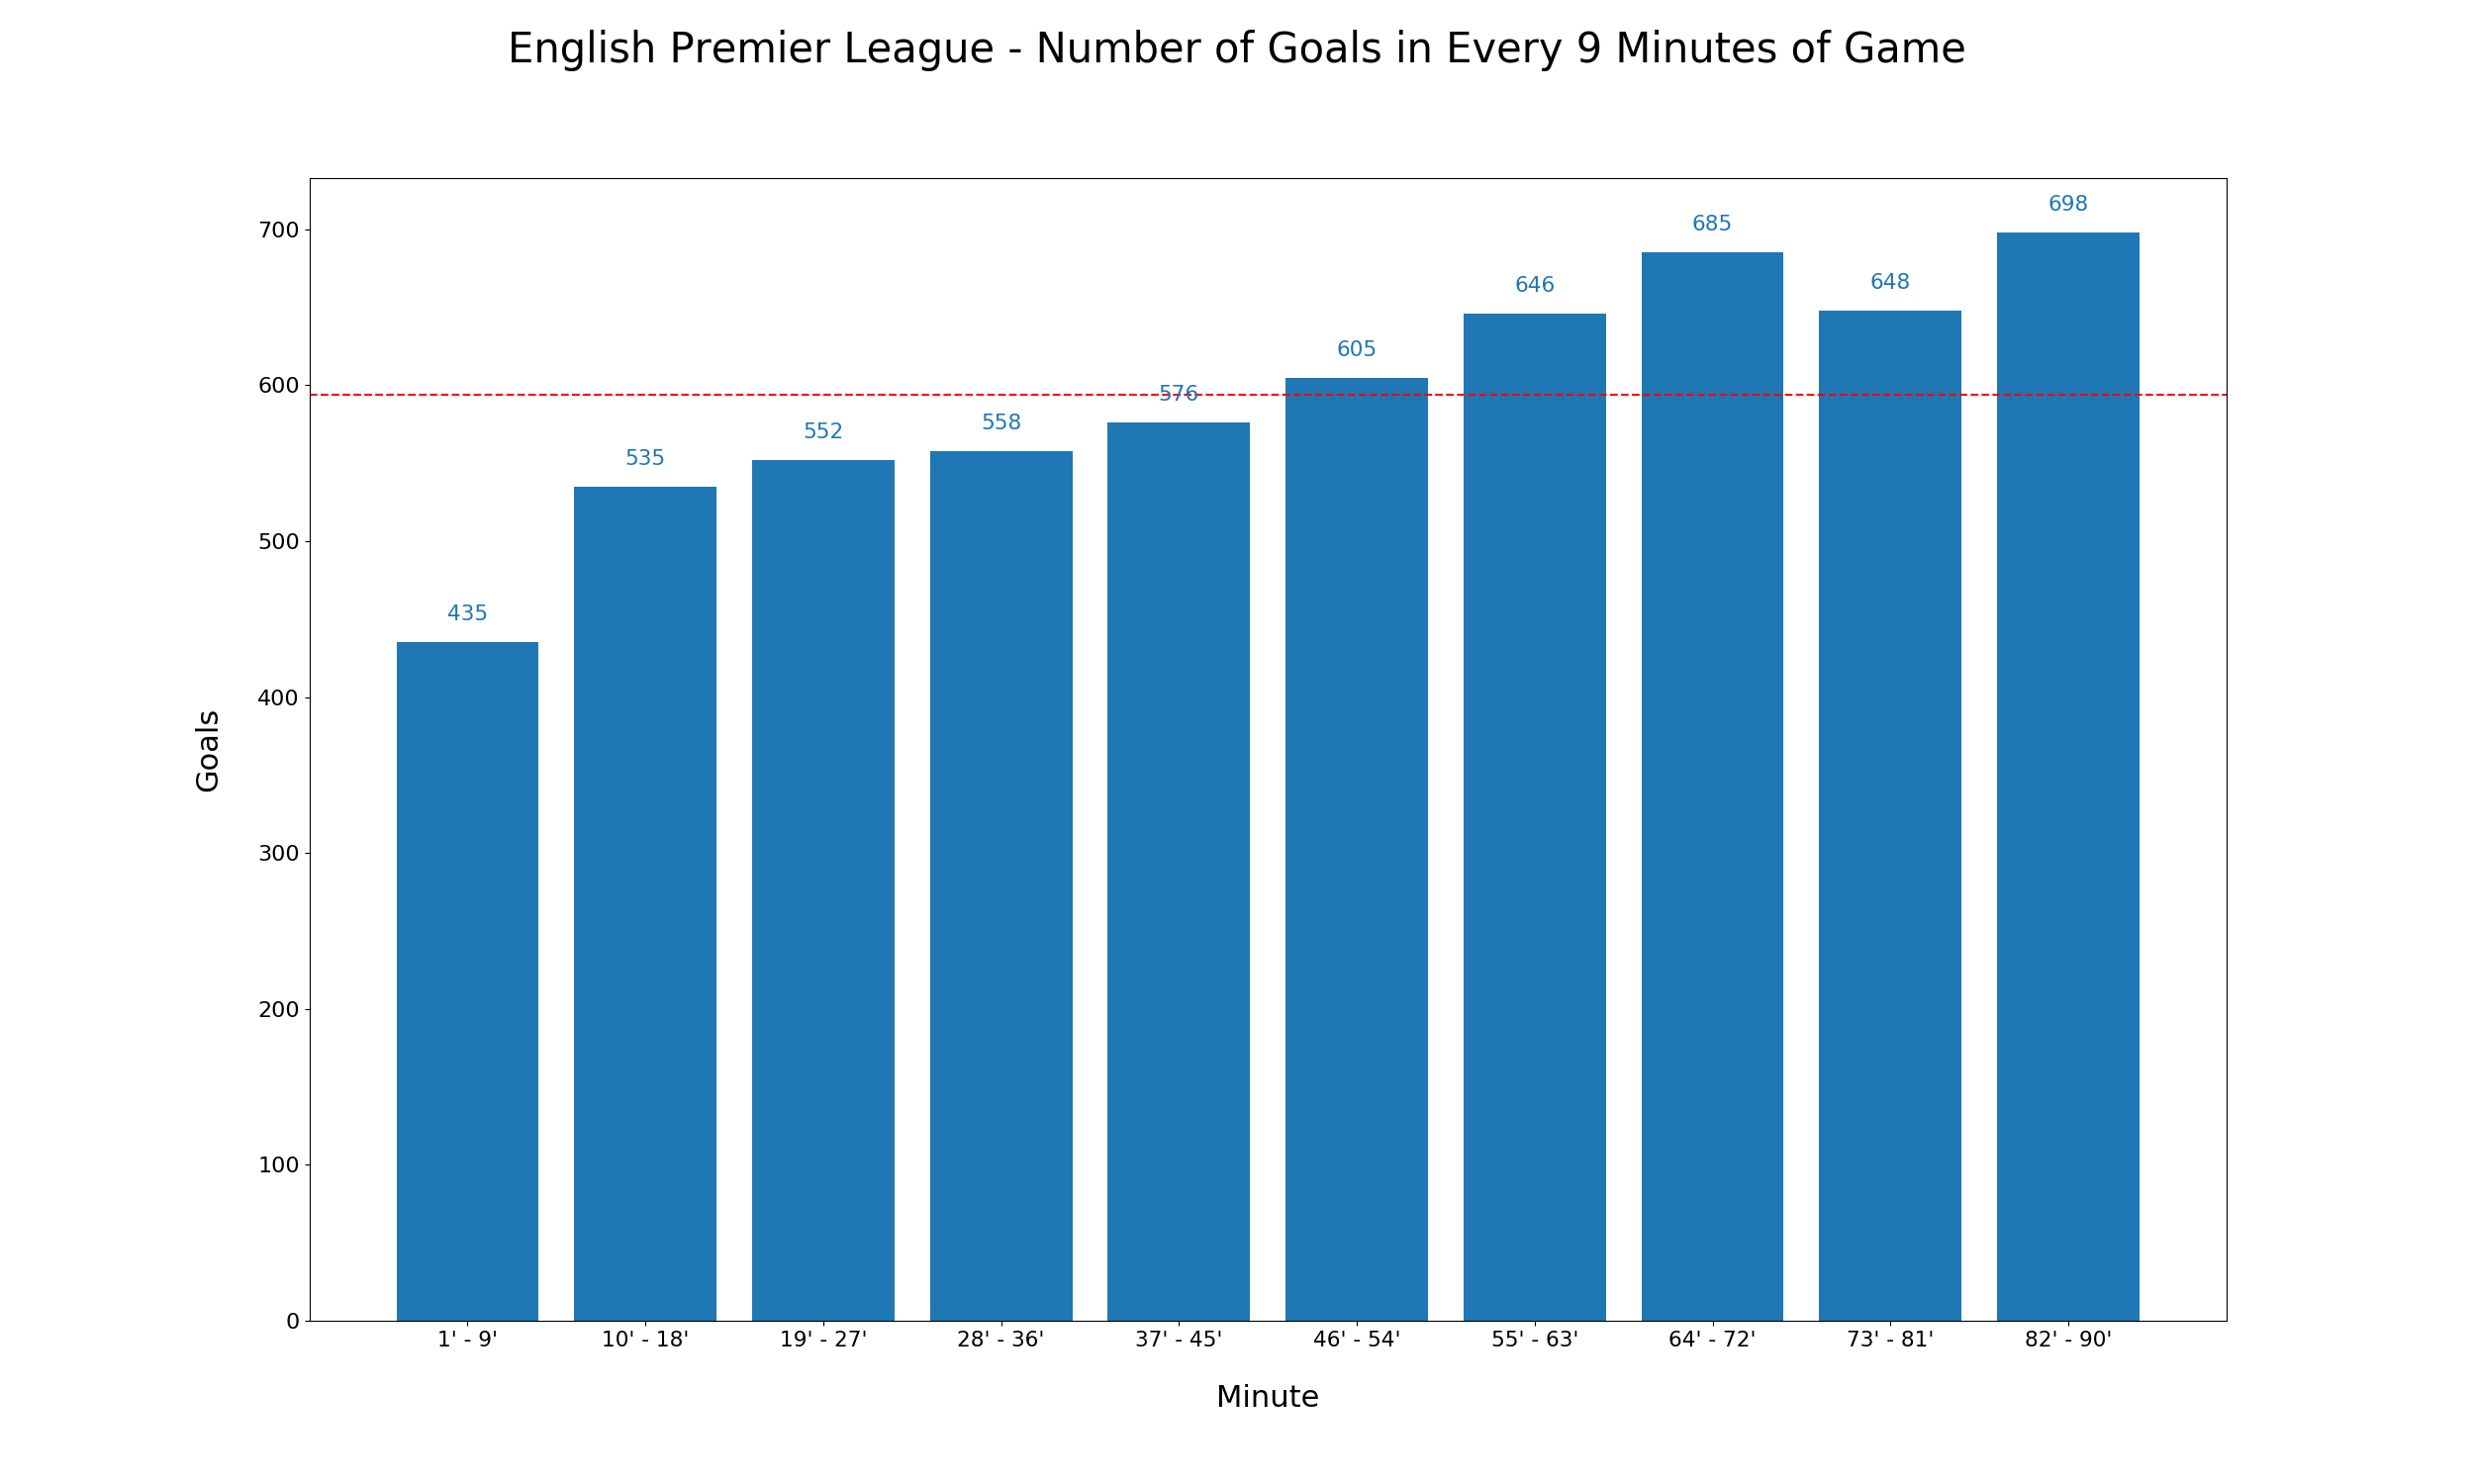
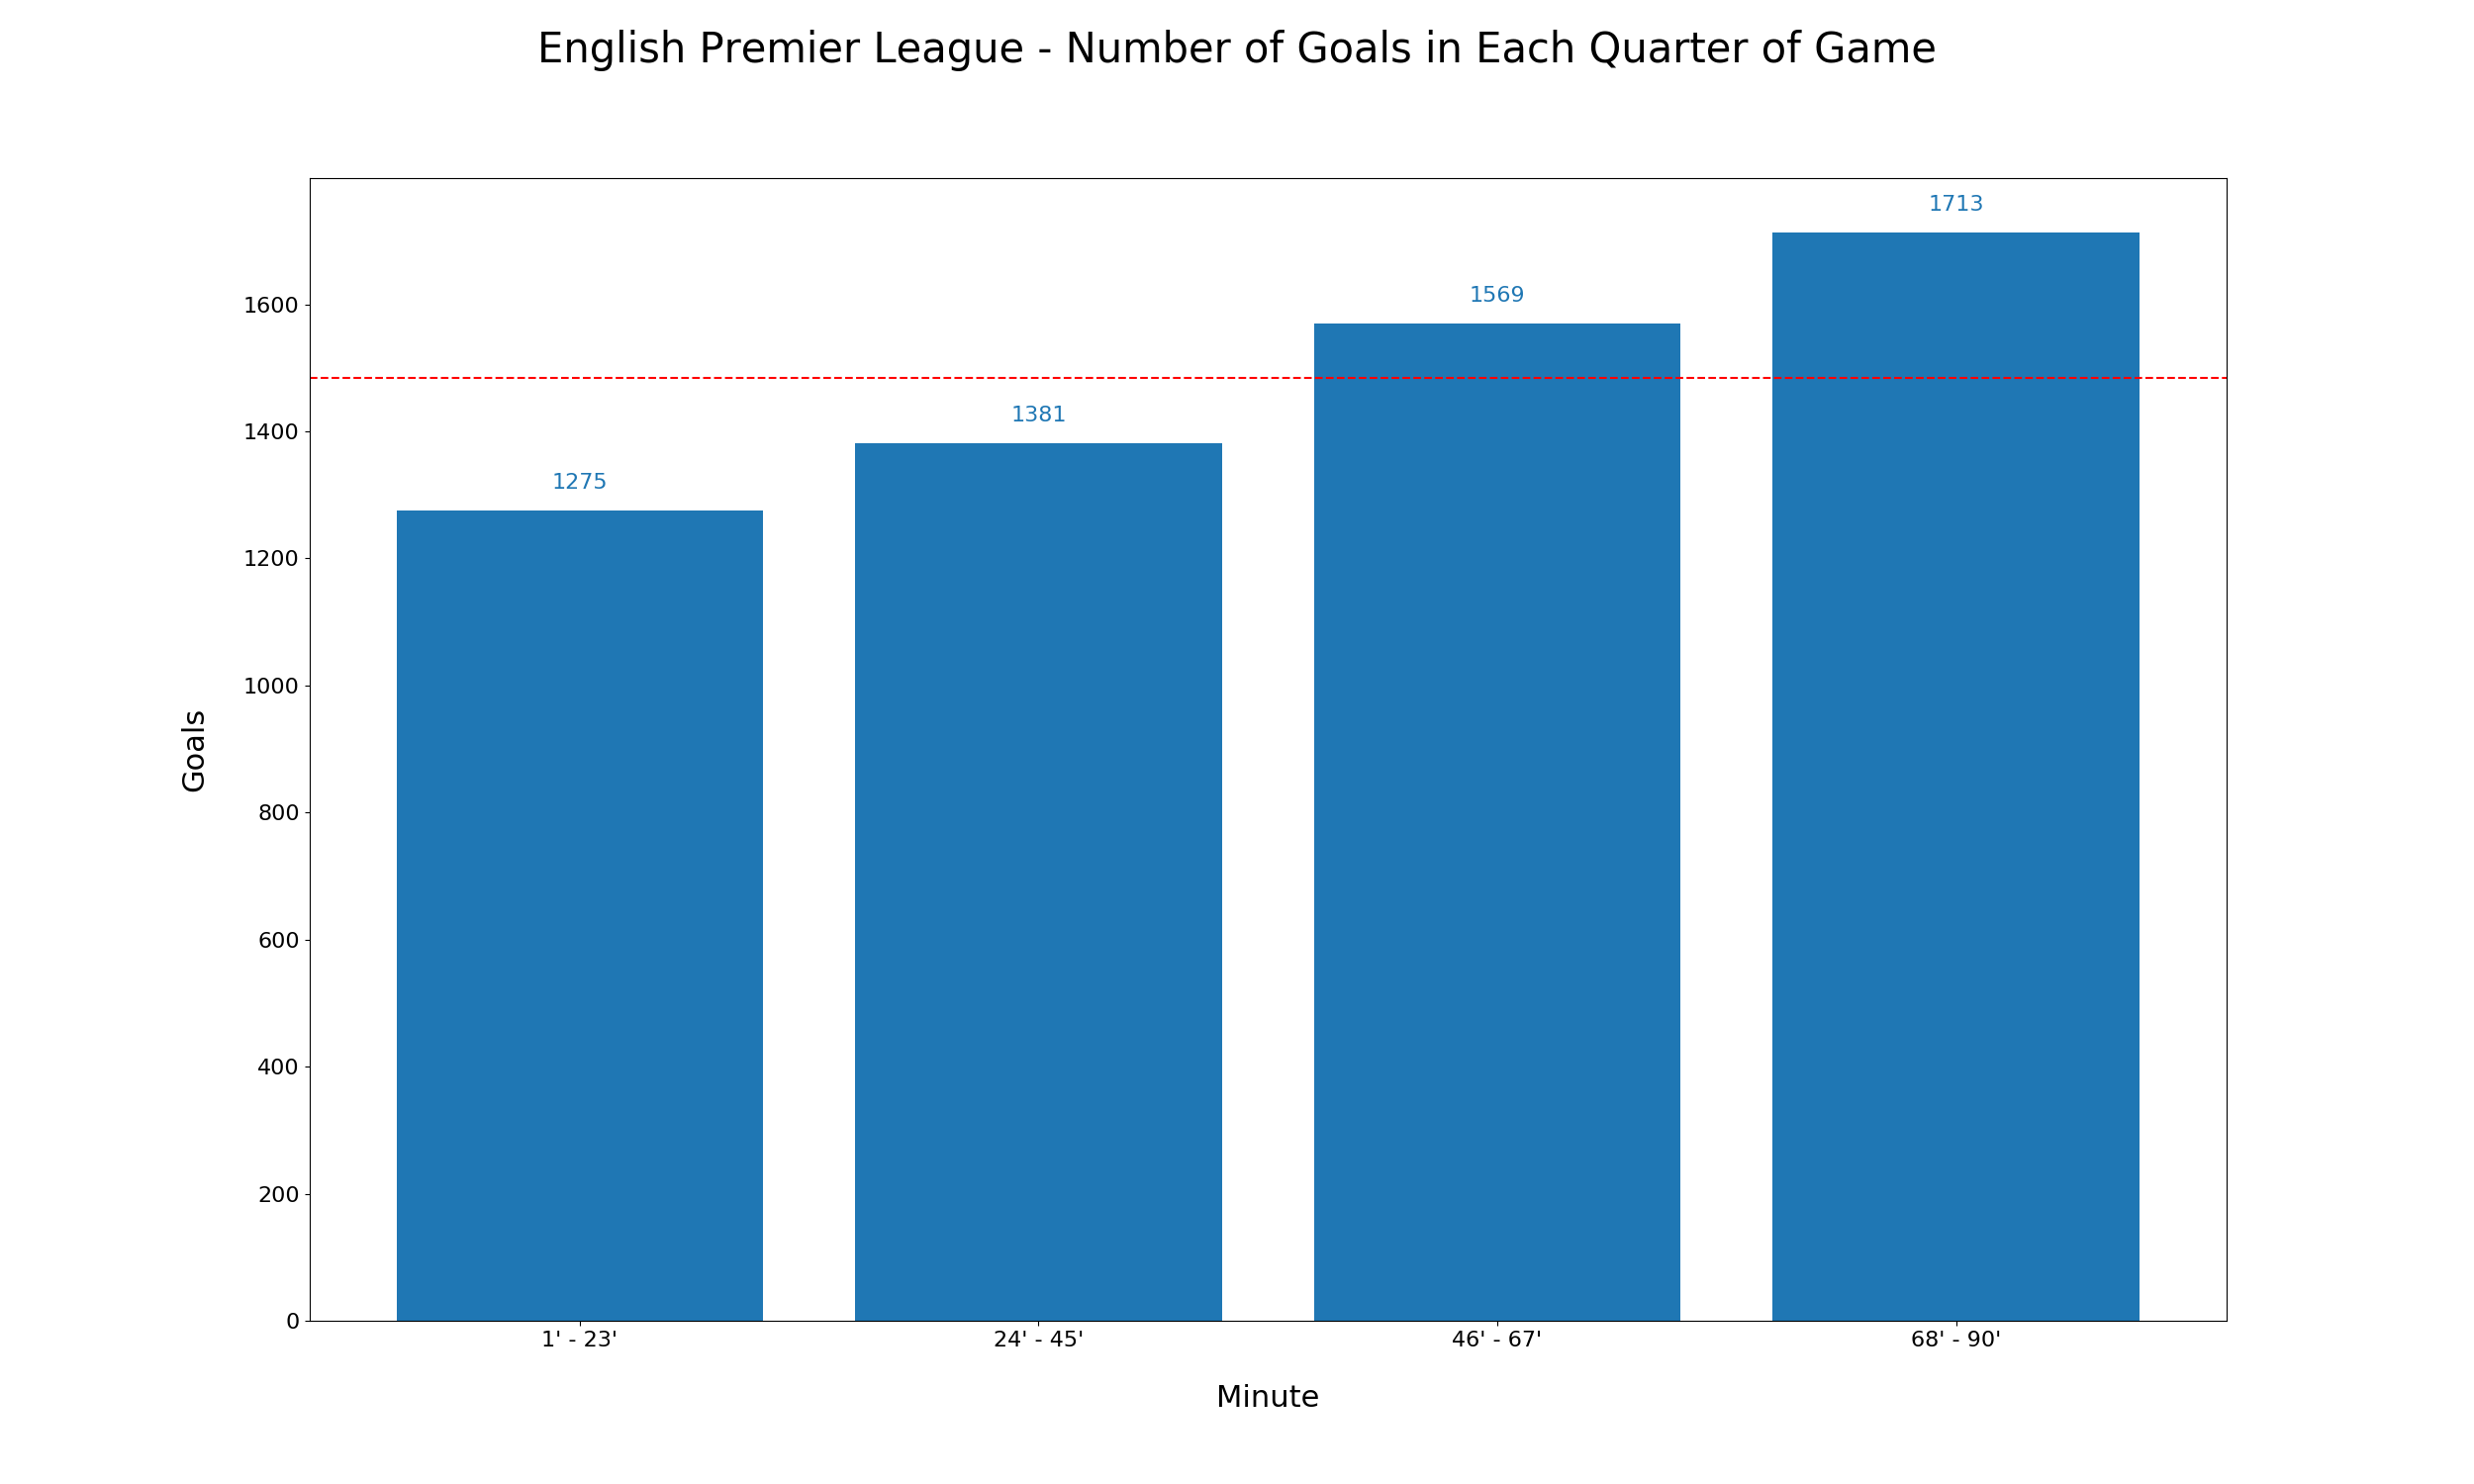
Other Leagues
This trend was consistent in other soccer leagues too. In the 2,275 English Premiere League games analyzed from 2013-2019, goals were more likely to be scored near the end of the games as well:

Game-Winning Goals
Also as hypothesized, it is more likely for game-winning goals to occur towards the end of a match. In fact, the final third of a soccer match will usually experience more game-winning goals than the previous two thirds combined.
Other Interesting Questions
And just for kicks, here are the answers to the other additional questions posed:
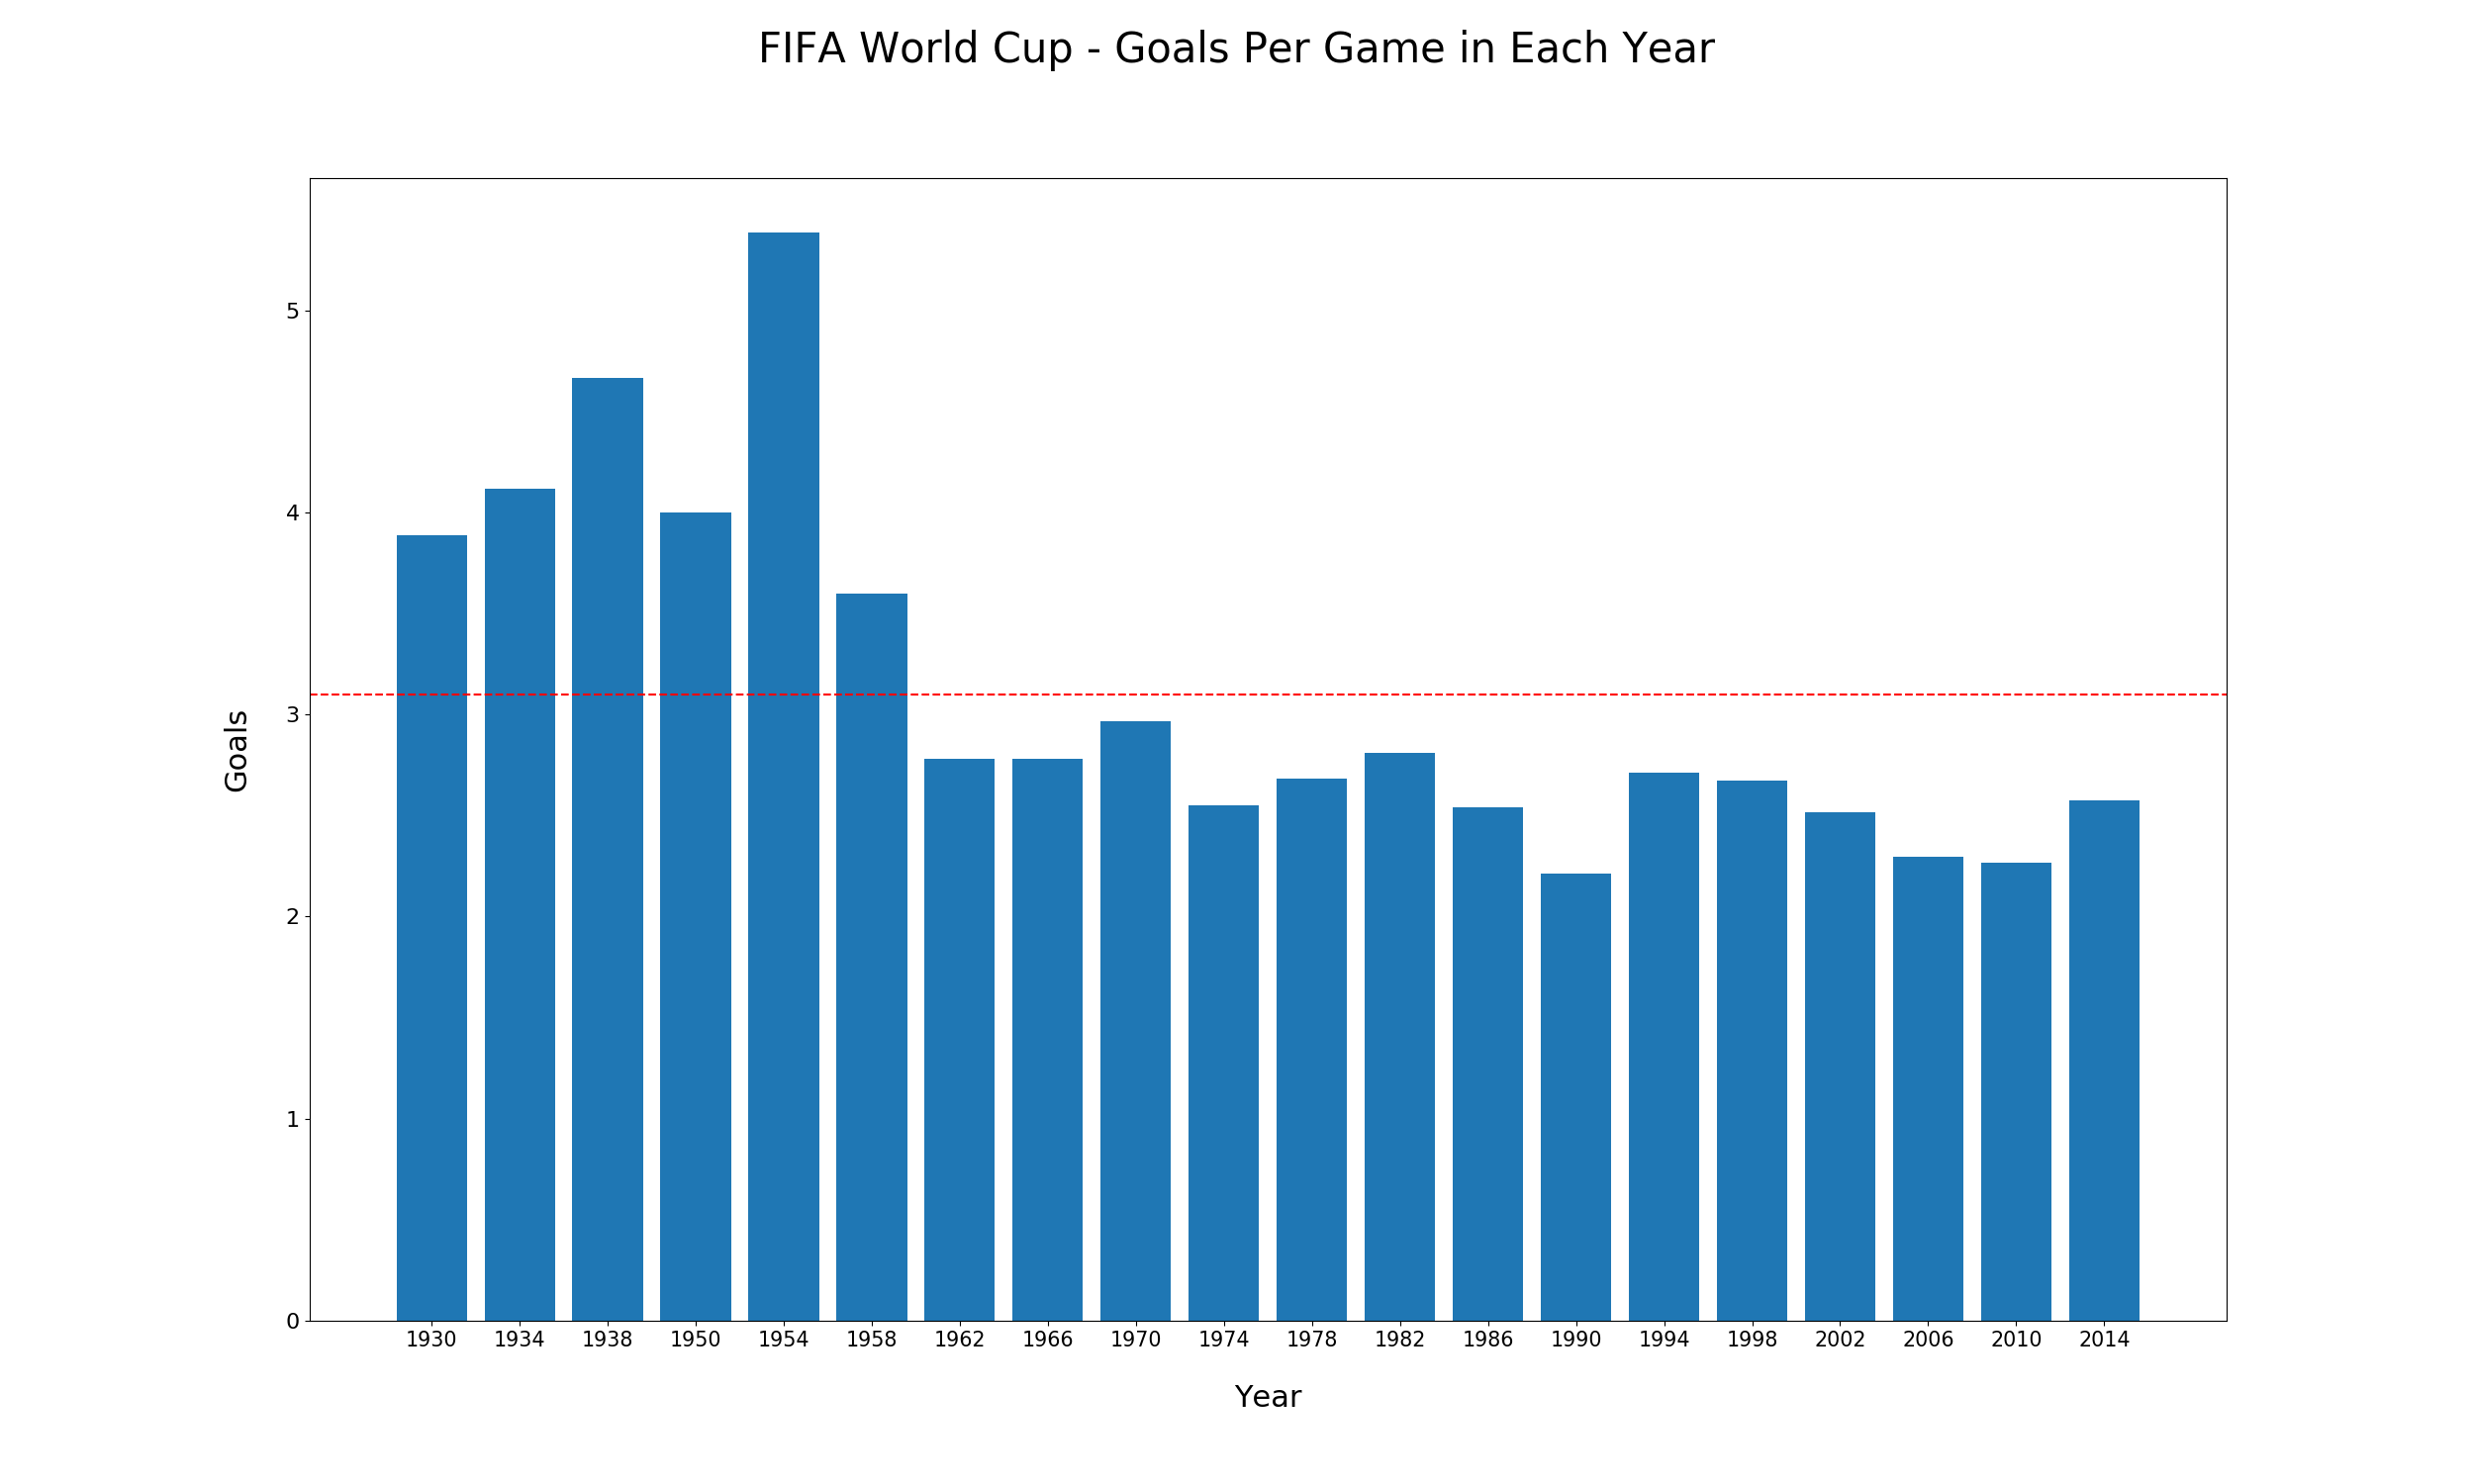
- Has scoring become more common in the World Cup over time? No. In fact, it appears to have decreased over time.
- When are the most penalty kicks scored? There have not been enough penalty kicks for this to be statistically significant. But fun fact, there has never been one in the first minute of a FIFA World Cup game!
- Are there more goals in a World Cup match than an English Premier League match? Yes and no. Using all World Cup data since 1930 and only recent EPL data, yes, but this is skewed due to the high scoring nature of the first few World Cups. Looking at more recent World Cups, no, they both have about the same average goals per game of ~2.5-2.75.
Summary
In conclusion, World Cup goals are statistically more likely to be scored in the final quarter of the game than any other. If you have to predict a minute for when a goal will occur, you're best bet is to choose one between the 82nd and 90th minutes. Now you'll just have to tune in and watch the FIFA Women's World Cup Finals on Sunday to see!
Code
The code used for this analysis is open sourced and publicly available here on Github. Please feel free to run your own experiments and tests on the soccer data or contribute to the repository.